GBDC Quick Update: Reduced Borrowing Rates

The following information was previously provided to subscribers of Premium BDC Reports along with:

  • GBDC target prices/buying points
  • GBDC risk profile, potential credit issues, and overall rankings
  • GBDC dividend coverage projections and worst-case scenarios


This update discusses Golub Capital (GBDC) which is a BDC with ‘higher quality’ management, access to SBIC leverage, and its higher credit quality portfolio. GBDC has one of the most investor-friendly fee structures, with a base management fee that is calculated at an annual rate of 1.375% (compared to 1.50% to 2.00%, for many) of average adjusted gross assets, excluding cash and cash equivalents. GBDC’s fee structure includes a ‘total return hurdle’ which means that its incentive fee structure protects total returns to shareholders by taking into account capital losses when calculating the income portion of the fee. Incentive fees are paid after the hurdle rate is reached, requiring a minimum return on net assets of 8% annually. Once this hurdle is reached, the advisor is entitled to 100% of the income up to 10%. This ‘catch-up’ provision catches up the incentives to 20% of pre-incentive fee net investment income and then the advisor is paid 20% after the ‘catch-up’. However, GBDC is currently between the 8% and 10% hurdles so its incentive fees are much lower and basically ensures dividend coverage.


GBDC Recent Insider Purchases

  • The Chairman and CEO have purchased over $35 million of common shares over the last 10 months.


GBDC Dividend Coverage Update

I am expecting improved dividend coverage over the coming quarters for many reasons including portfolio growth through increased leverage, improved net interest margins, and recent/continued increases in its NAV per share.  For the three months ended March 31, 2021, GBDC hit its best-case projections with slightly increased portfolio yield (from 7.4% to 7.5%) and higher fee income partially offset lower portfolio growth (decline). Leverage (debt-to-equity) declined due to increased NAV per share and repayments/sales/exits exceeding new investments for the quarter. NAV per share increased by another 1.8% “primarily attributable to portfolio companies that generally continued to perform well. Strong performance across the portfolio was reflected in our internal performance ratings that have largely returned to pre-COVID levels.”


On February 24, 2021, GBDC closed an offering of $400 million of unsecured notes at 2.500% due in 2026. This is an excellent fixed rate for flexible unsecured borrowings and improves the overall strength of the balance sheet as well as lowering the overall borrowing rate.


As shown in the following chart, the net interest margin (green line) previously increased to 5.1% but declined slightly due to the higher weighted average cost of borrowings. Similar to all BDCs, management is working to reduce borrowing rates including the recently issued notes at 2.50% and lower-cost credit facilities. On February 11, 2021, GBDC entered into its $475 million JPM Credit Facility (one-month LIBOR plus 1.750% to 1.875%) and repaid its WF Credit Facility (one-month LIBOR plus 2.000%).

“GBDC took advantage of attractive market conditions to continue to optimize its balance sheet. We executed a second unsecured bond issuance, building on the success of our inaugural offering last year. We also closed a new corporate revolver. These financings are consistent with the strategy you have heard us discuss before, low-cost, flexible financing with limited near-term maturities.”

“On February 11th, we closed on a $475 million revolving credit facility with JPMorgan which matures on February 11, 2026, and has an interest rate that ranges from one-month LIBOR +1.75% to one-month LIBOR + 1.875%. Second, On February 24th, we issued $400 million of unsecured notes, which bear a fixed interest rate of 2.5% and mature on August 24, 2026. With the completion of our second unsecured debt issuance, our percentage of unsecured debt as a percentage of total debt increased to 38.0% as of March 31st. And finally, on February 23rd, we decreased the borrowing capacity under our revolving credit facility with Morgan Stanley to $75 million. After the end of the quarter, we further amended this revolving credit facility to, among other things, extend the reinvestment period through April 12, 2024, extend the maturity date to April 12, 2026, and reduced the interest rate on borrowings to one-month LIBOR + 2.05% from one-month LIBOR + 2.45%.”


Full BDC Reports

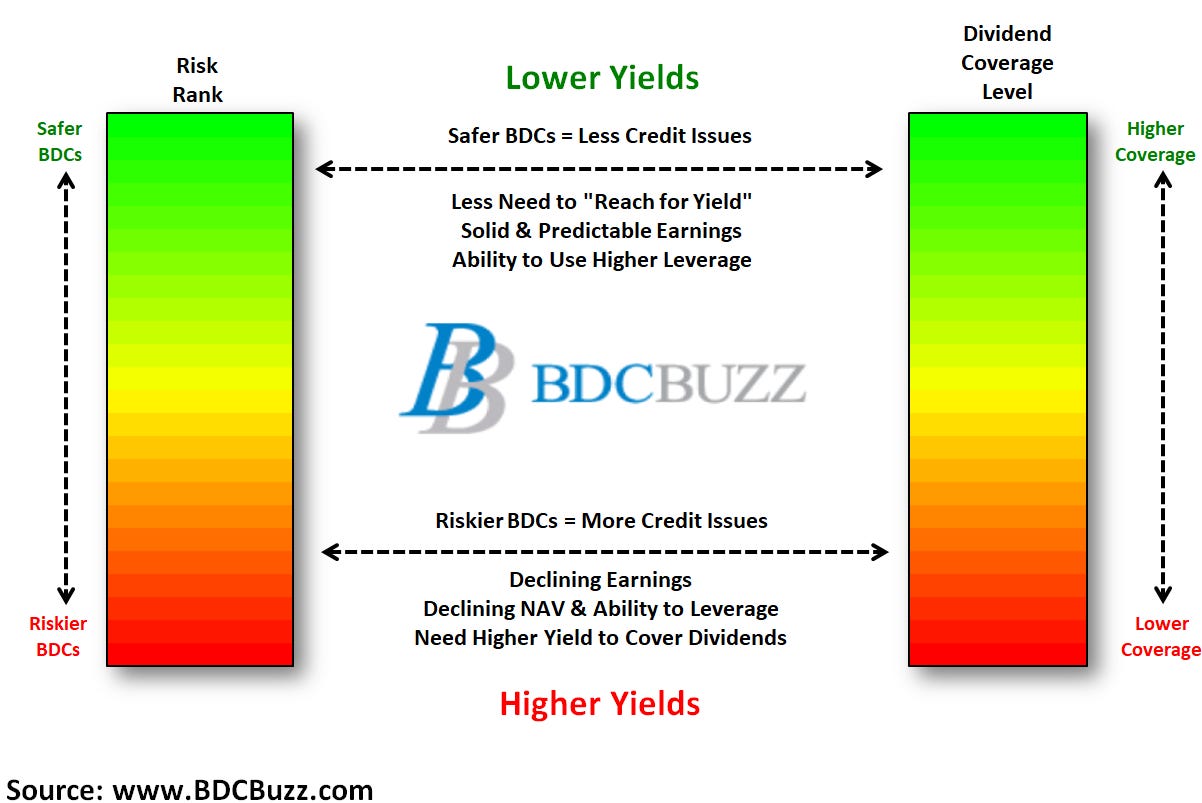
This information was previously made available to subscribers of Premium BDC Reports. BDCs trade within a wide range of multiples driving higher and lower yields mostly related to portfolio credit quality and dividend coverage potential (not necessarily historical coverage). This means investors need to do their due diligence before buying.

FDUS Update: Baby Bonds “FDUSZ” and “FDUSG”

The following information was previously provided to subscribers of Premium BDC Reports along with:

  • FDUS target prices/buying points
  • FDUS risk profile, potential credit issues, and overall rankings
  • FDUSdividend coverage projections and worst-case scenarios


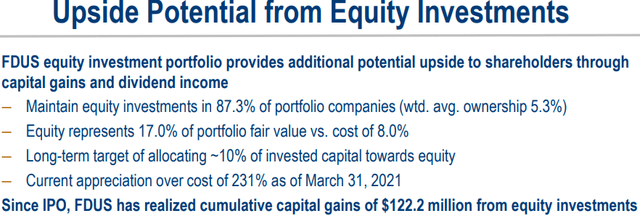
This update discusses Fidus Investments (FDUS) which has provided investors with higher returns supported by equity investments. FDUS has maintained NAV per share performance and realized gains relative to most BDCs with equity investments in over 87% of its portfolio companies which is primarily responsible for NAV growth and dividend income to support supplemental/special dividends paid over the last 8 years.


FDUS Dividend Coverage Update

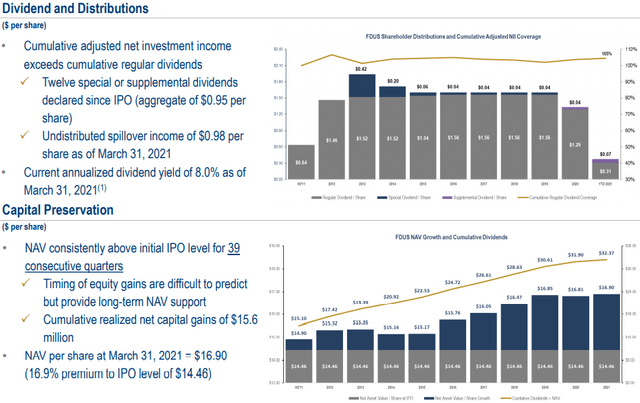
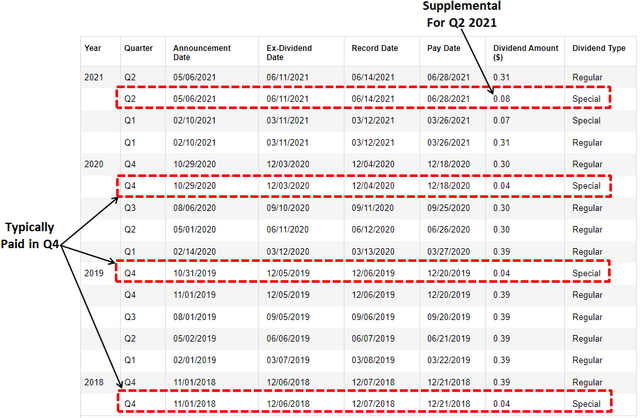
On May 6, 2021, the company reaffirmed its regular quarterly dividend of $0.31 and another supplemental dividend of $0.08 for Q2 2021. As of March 31, 2021, the company had $0.98 per share of spillover income (or taxable income in excess of distributions) that can be used for additional supplemental dividends.

As predicted in previous reports, FDUS slightly increased its regular dividend in February 2021 and recently announced a dividend strategy that includes an easily sustainable regular dividend as well as a variable portion to pay out the excess earnings as needed (similar to TSLX, HTGC and CGBD) and was discussed on the call:

“The Board has devised a formula to calculate the supplemental dividend each quarter, under which 50% of the surplus and adjusted NII over the base dividend from the prior quarter is distributed to shareholders. For the second quarter, the surplus is $0.15 per share. Therefore, on May 03, 2021, the Board declared a base quarterly dividend of $0.31 per share, and a supplemental quarterly cash dividend of $0.08 per share.”

From previous call: “As a result of the steady improvement in the overall health of the portfolio since then, the Board has increased the base quarterly dividend by $0.01 to $0.31 per share and implemented a supplemental quarterly dividend for 2021 equal to 50% of the surplus in adjusted NII over the base dividend for the prior quarter. Being aggressive with dividend policy just doesn’t seem like the right thing to do. We feel this approach is a good solution for at least 2021 and provide significant upside to the base dividend as we had in the last two quarters, while also providing what I would say is a durable and flexible distribution model in these uncertain timesWill this be a permanent move? It could be. I think the base dividend is something we will always look at, but the approach is a good one. And I wouldn’t say we are the first to do this. But I do think it’s a good one, especially in this environment and we will consider kind of on a permanent basis as well as we move forward, but this is a 2021 move at this point.”


Also, previous reports correctly predicted the reduction in FDUS’s quarterly dividend from $0.39 to $0.30 per share announced in May 2020. FDUS has paid supplemental dividends over the last 8 years but usually in Q4 (last 5 years) and many of them are around $0.04 as shown below.

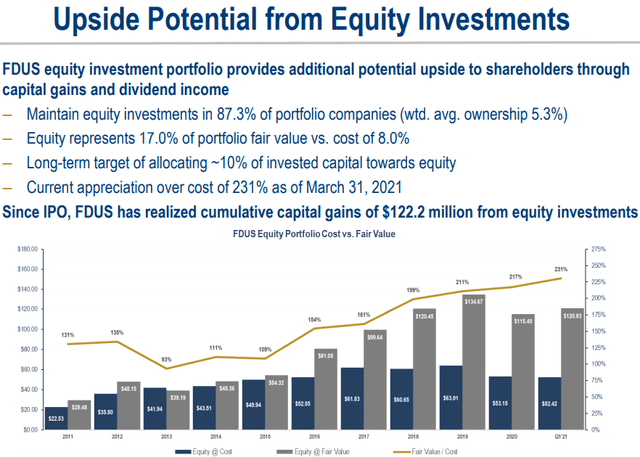
There is the potential for significant realized gains related to the exit of certain equity investments including Pfanstiehl, Inc.Pinnergy, Ltd., and Global Plasma Solutions which were among the largest markups in 2020. If these investments were sold at the fair value as of March 31, 2021, would imply potential realized gains of over $61 million or $2.51 per share which would likely drive a significant increase in supplemental dividends over the coming quarters. Also, these investments currently account for 9.1% of the portfolio fair value and could be reinvested into income-producing assets driving higher earnings and a potential increase in the regular dividend.


However, FDUS does not have a controlling interest in these companies, and management mentioned “there is no rush” to exit Pfanstiehl as the company has additional upside potential:

“We did rotate half of our investment and rotate out of it in Q1 of last year. Pfanstiehl is a manufacturer of high-purity sugars and active ingredients for injectable drugs and biologic drugs, mostly in the oncology arena, are focused on the oncology arena. They also do participate in the vaccine arena to a certain degree. I’d say the company is performing very well, and the outlook is also strong. So the positives are outweighing any potential negatives of COVID-19 at this point in time. So valuation reflects the performance of the company. And I would say, look, we’re – we like the outlook of the business. We are not in control of the company and that would require discussions with the company or sale of the business which neither of what are happening at this point, but I don’t think there is any rush.”

During Q1 2021, FDUS had net realized gains of $3.2 million or $0.13 per share due to exiting many of its equity investments including Software Technology, Rohrer, and FDS Avionics:

“We have equity investments and approximately 87.3% of our portfolio companies with weighted average fully diluted equity ownership of 5.3%. For the three months ended March 31, we recognized approximately $3.2 million of net realized gains from the sale of several equity investments including Software Technology a $1.4 million gain, FDS $0.9 million gain, and Rohrer $0.9 million gain.”

The updated projections take into account lower amounts of expected fee income (relative to the previous quarter) and continued repayments offset by new investments:

“When I look at Q2 from a fee perspective, my current expectation would be for fees to be lower. In Q1, we had about $3.1 million of fees approximately half of that was from prepayments. And so in Q2, I would expect our fees to really be driven more from origination activity and maybe to a minor extent, maybe a few amendment fees, but not the level of prepayment fees we saw in Q1. We expect Q2 to be relatively busy from origination perspective this quarter was I guess in April, we had $43 million in origination. We’re working hard on several opportunities right now. We do expect repayments to continue through the year, but at a slower pace than the recent past. Overall, we believe the portfolio is headed in the right direction and remains well structured in support of our capital preservation and income goals. Our strategy is working and we remain committed to our goal of growing net asset value over time through careful investment selection, and focus on preservation and on generating attractive risk adjusted returns.”

Also taken into account with the updated projections are the following subsequent events:

  • On April 1, 2021, we invested $11.0 million in first lien debt of Winona Foods, a leading provider of natural and processed cheese products, sauces, and plant-based alternatives.
  • On April 1, 2021, we invested $5.5 million in first lien debt and $1.0 million in common equity of Level Education Group, LLC (dba CE4Less), a leading provider of online continuing education for mental health and nursing professionals.
  • On April 5, 2021, we invested $25.5 million in first lien debt, common equity, and made a commitment up to $2.0 million of additional first lien debt of ISI PSG Holdings, LLC (dba Incentive Solutions, Inc.), a tech-enabled incentive rewards and digital marketing firm that facilitates and optimizes its clients’ indirect sales channel strategies.
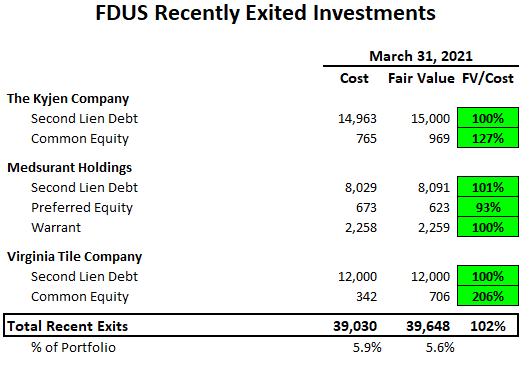
  • On April 5, 2021, we exited our debt investment in The Kyjen Company (dba Outward Hound). We received payment in full of $15.0 million on our second lien debt, which includes a prepayment fee.
  • On April 14, 2021, we exited our debt investment in Medsurant Holdings. We received payment in full of $8.0 million on our second lien debt.
  • On April 29, 2021, we exited our debt investment in Virginia Tile Company. We received payment in full of $12.0 million on our second lien debt.


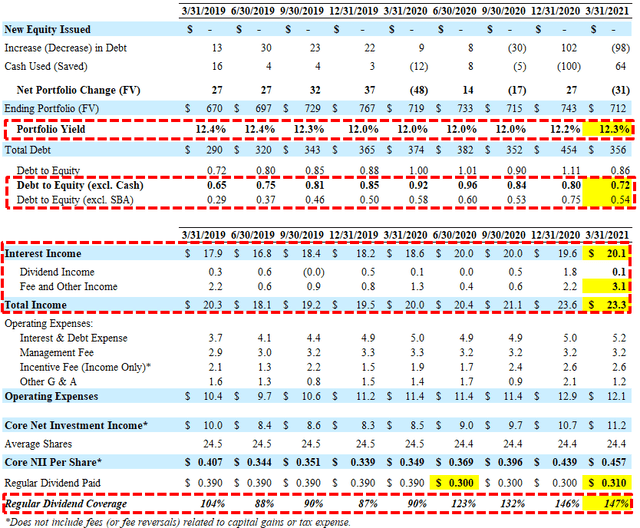
For Q1 2021, FDUS easily beat its best-case projections covering 147% of its quarterly regular dividend due to much higher-than-expected fee income resulting from an increase in prepayment and amendment fees, partially offset by a decrease in origination fees.

“I would say Q1 fee income was a little higher than normal. There were some events there that were large events, not small, that’s been obviously positive, and it’s a benefit of our model. But it’s not something that I would say is going to reoccur every quarter for sure.”

Edward Ross, Chairman and CEO: “For the first quarter, our portfolio generated strong adjusted NII, including a lift from fee income. NAV per share grew for the fourth consecutive quarter reflecting an ongoing trend of improving health of the portfolio overall since the pandemic began last year. As a result of continued high levels of M&A activity in the lower middle market, repayments were once again above historical averages and, as expected, outpaced originations.”

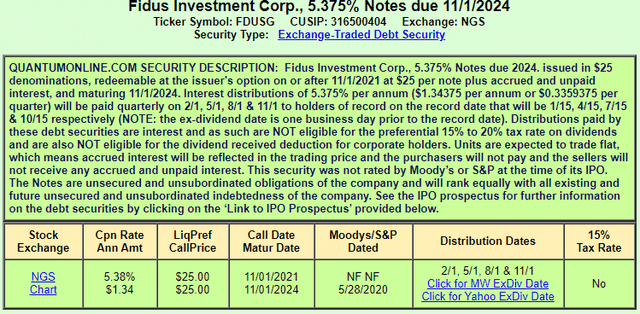
Baby Bonds “FDUSZ” and “FDUSG”

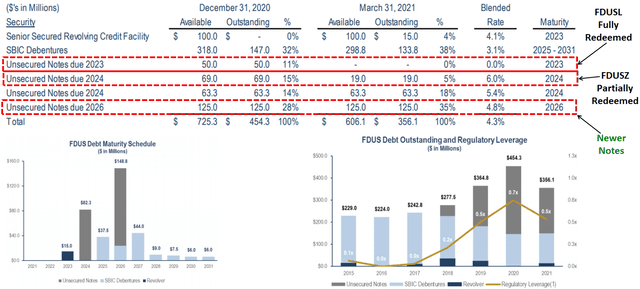
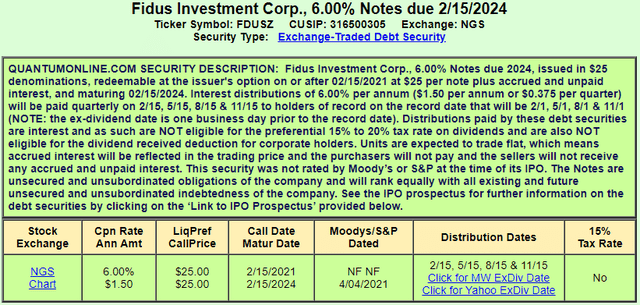
On December 16, 2020, FDUS priced a public offering of $125 million of 4.75% unsecured notes due January 31, 2026, and used the proceeds to redeem all of its outstanding 5.875% notes due 2023 (FDUSL) and “a portion” of its outstanding 6.000% notes due 2024 (FDUSZ) callable on February 15, 2021). On December 23, 2020, FDUS announced the redemption of $50 million of 6.000% notes due 2024 (FDUSZ) total of $69 million) Notes on February 16, 2021.

“In Q1, using the proceeds from our December bond offering, we fully redeemed our 5.875% $50 million notes due 2023 and partially redeemed $50 million of our 6% public notes due 2024. In addition, we paid down $19.2 million of SBA debentures and our second SBIC fund. We realized a one-time loss on extinguishment of debt in Q1 of approximately $2.2 million from the acceleration of unamortized deferred financing cost on the redeem bonds and SBA debentures.”
FDUSZ and FDUSG are considered ‘lower risk’ Baby Bonds due to the company having higher quality management and better-than-average historical credit performance as well as an adequate asset coverage ratio and interest expense coverage which are shown in the updated projections.

The “Bond Risk” tab in the BDC Google Sheets includes a summary of metrics used to analyze the safety of a debt position such as the “Interest Expense Coverage” ratio which is used to see how well a firm can pay the interest on outstanding debt. Also called the times-interest-earned ratio, this ratio is used by creditors and prospective lenders to assess the risk of lending capital to a firm. A higher coverage ratio is better, although the ideal ratio may vary by industry. When a company’s interest coverage ratio is only 1.5X or lower, its ability to meet interest expenses may be questionable.


Full BDC Reports

This information was previously made available to subscribers of Premium BDC Reports. BDCs trade within a wide range of multiples driving higher and lower yields mostly related to portfolio credit quality and dividend coverage potential (not necessarily historical coverage). This means investors need to do their due diligence before buying.

Quick Preview: “REITs Continue To Underperform BDCs”

The following information was previously provided to subscribers of Premium BDC Reports along with target prices, dividend coverage and risk profile rankings, earnings/dividend projections, quality of management, fee agreements, and my personal positions for all Business Development Companies (“BDCs”).


As discussed last month in “This High-Yield Sector Continues To Pummel REITs“, Business Development Companies (“BDCs”) have easily outperformed Real Estate Investment Trusts (“REITs”) and are starting to get some “respect” for the reasons discussed in previous articles (see list below) including minimal investments in cyclical sectors (discussed below), stronger credit performance than many private equity/debt funds and even many banks during recessionary periods, maintaining and often improving dividend coverage while others are cutting.

BDC pricing (multiples and yields) continues to head back to levels from early 2014 before the S&P and Russell removed BDCs from their indexes due to concerns cited by the indexes, including the distortion of expense ratios driven by AFFE rules. This was predicted and discussed last year in “New SEC Rules Could Improve Pricing For The BDC Sector“.


Introduction to Business Development Companies (“BDCs”)

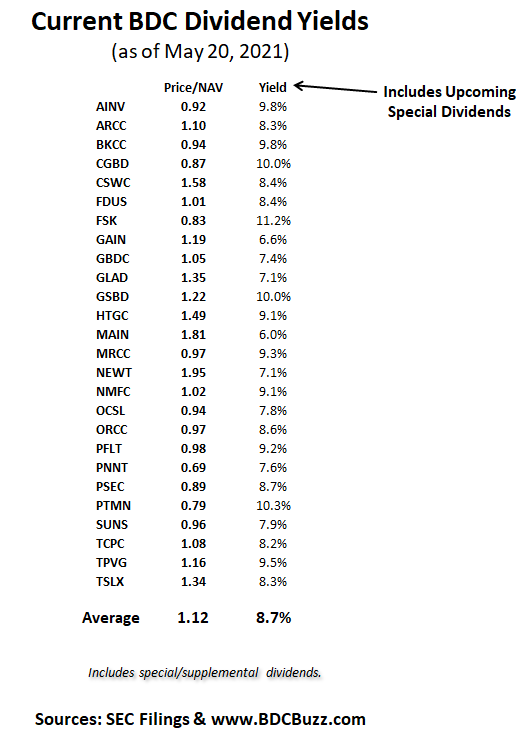
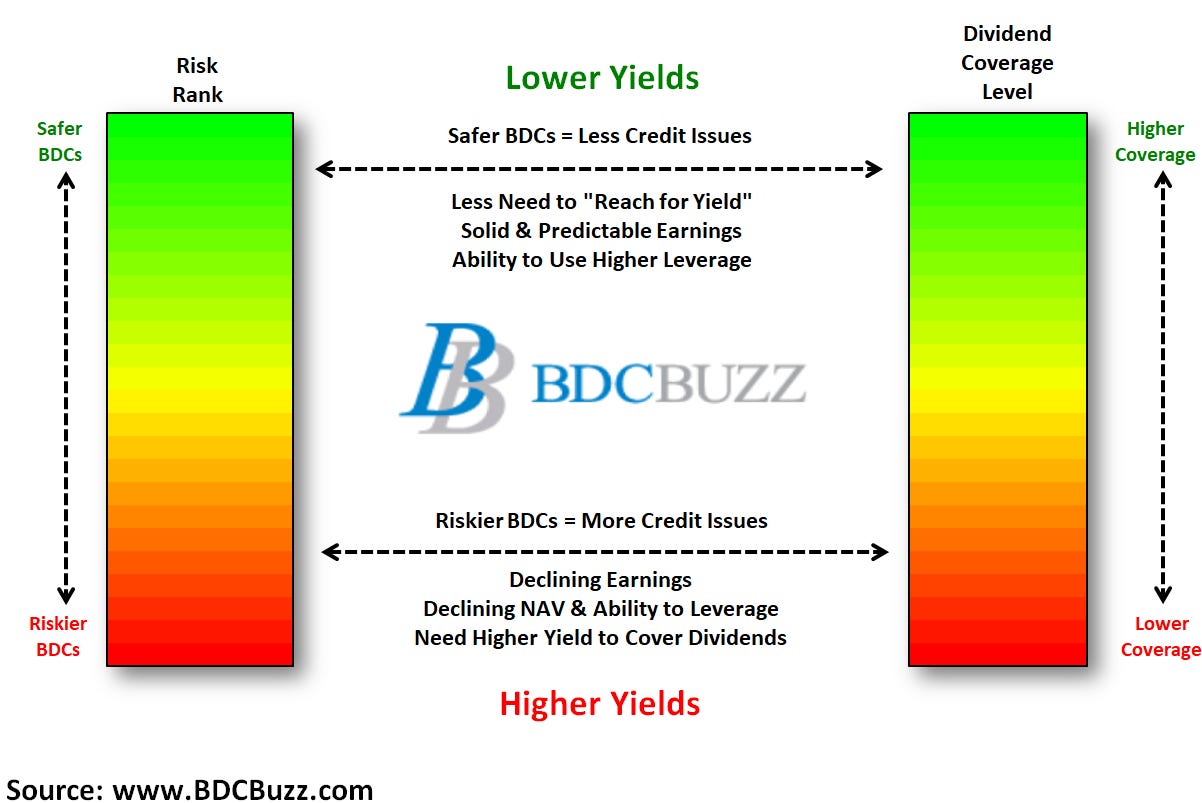
Similar to REITs, Business Development Companies (“BDCs”) are regulated investment companies (“RICs”) required to pay at least 90% of their annual taxable income to shareholders, avoiding corporate income taxes before distributing to shareholders. This structure prioritizes income to shareholders (over capital appreciation), driving higher annual dividend yields that mostly range from around 6% to 10%.


Comparison or BDC and REIT Returns Since 2015

  • It should be noted that the BDC sector is relatively new and many of the best BDCs have not been publicly traded for longer than 10 years.

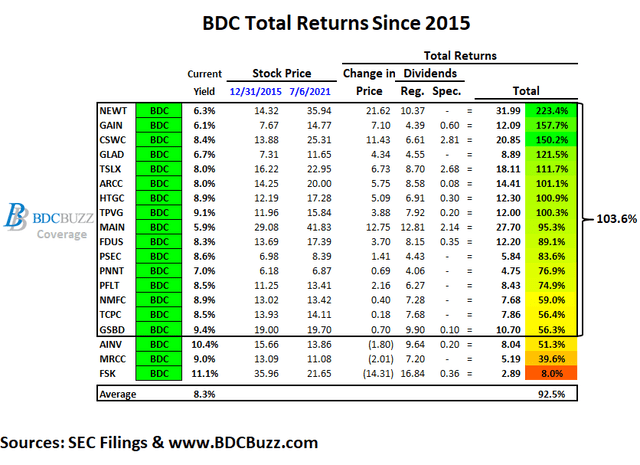
As mentioned in the article linked above, BDCs have easily outperformed REITs over the last 18 months but the following tables show the comparable total returns since 2015 which takes into account 2 major pullbacks in BDC pricing (2018 and 2020).

The following tables assume that you purchased each position at the close of Dec. 31, 2015, and sold at the close of July 6, 2021, collecting (not reinvesting) the dividends (includes paid, accrued, specials, and supplementals). Please see the end of this article for my takeaways from these tables.

I have included many of the BDCs that I cover as well as some others along with many of the larger/popular equity and mortgage REITs. The top performers were predicted/discussed in previous articles including:


Comparison or BDC and REIT Returns Since 2019

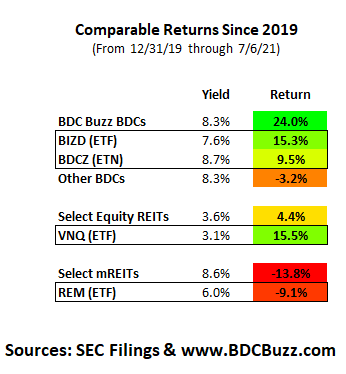
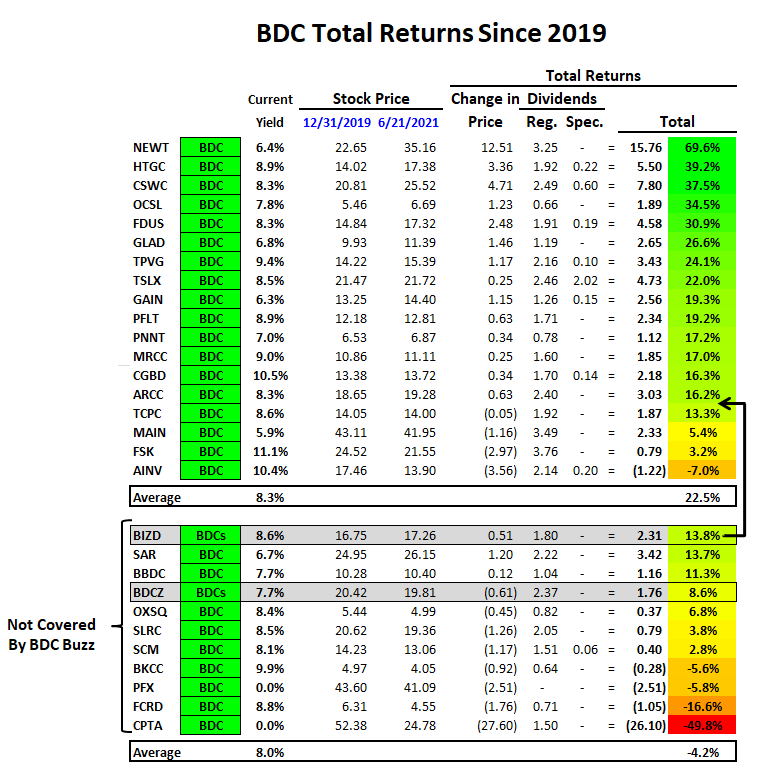
The following tables show the updated returns over the last 18 months including VanEck Vectors BDC Income ETF (BIZD) and WF BDC Index ETN (BDCZ) which continually underperform the average for the reasons discussed in “ETFs Are The Worst Way To Invest In This High-Yield Sector“.

I do cover some of the lower return BDCs including AINV due to being one of the ‘older’ BDCs and FSK only due to being one of the largest in the sector especially after taking into account the merger with FSKR. It should be noted that BDCZ has quite a bit of exposure to many of the lower-performing BDCs including FSK and FSKR that accounted for more than 15.5%.

The “Other BDCs” include many of the lower performing companies that I do not actively cover including SLRCSCMOXSQBBDCHCAPPFXBKCCFCRD, and SAR. It should be noted that all of these BDCs with the exception of SAR and BBDC have not reached their pre-COVID stock price levels similar to AINV and FSK partially responsible for the lower returns. Also, most of these BDCs have cut their dividends and will be discussed in the next article.


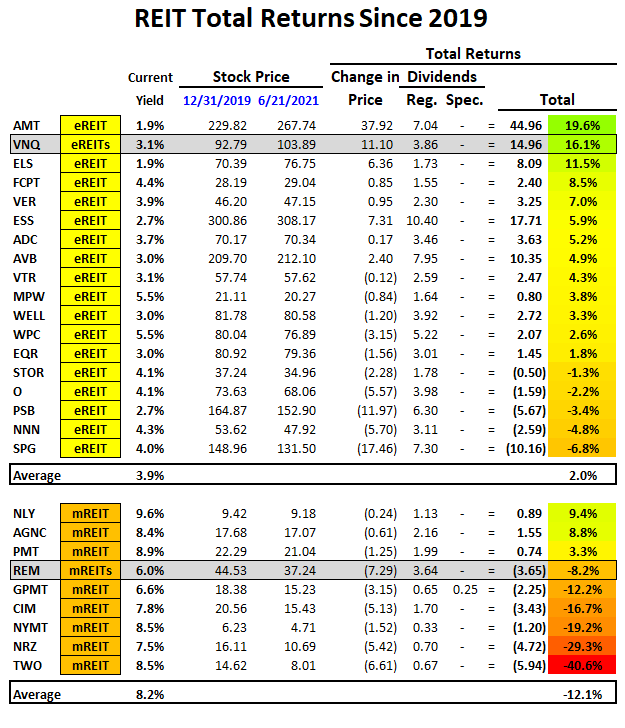
The following tables show the comparable REIT returns including the Vanguard Real Estate Index Fund (VNQ) and a Mortgage REIT Index (REM) which have outperformed many/most of the larger REIT components. As mentioned in previous articles, I only invest in VNQ (during market pullbacks) for my REIT allocation which has easily outperformed many of its components including AVBESSEQRSPGADCWPCFCPTONNNSTOR, and PSB.


Why do REITs Underperform BDCs?

Upcoming articles will discuss many of the reasons that the average REIT underperforms the BDC sector including return on equity (“ROE”) measures and dividends/distributions paid to shareholders and some simple fundamentals including changes in net asset/book values.

It should be noted that most BDCs continue to position their portfolios away from cyclical sectors and into growth, technology, defensive sectors that will continue to do well over the coming quarters. Also, almost every BDC used the recent pandemic to strengthen their balance sheets with longer-term unsecured borrowings at extremely low fixed rates. These changes have resulted in much stronger balance sheets ready for anything from an economic recession to an overheated economy driving higher interest rates.

Source: ARCC Debt Investor Presentation

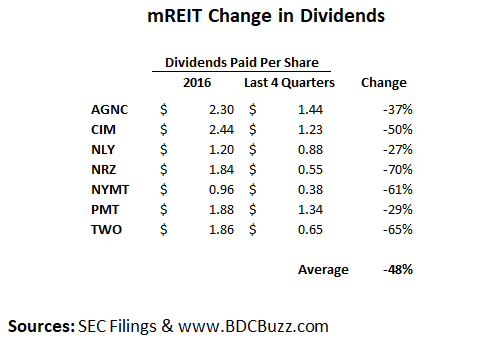
I will likely not spend much time on mortgage REITs as I do not see these as long-term holding positions. The following table shows the change in mortgage REIT distributions for the companies listed in the previous tables (excluding GPMT which became publicly traded in 2017) showing an average decline of almost 50%:

Also, I will discuss portfolio allocations for BDCs and REITs, total return comparisons between additional (smaller and less known) BDCs and REITs, other considerations including risk and pricing volatility. Again, the BDC sector is relatively new and many of the best BDCs have not been publicly traded for longer than 10 years but I will provide comparisons of some of the older BDCs in upcoming articles.


Summary & Takeaways

The following table includes the return comparisons from the previous tables with some quick takeaways below that will also be discussed in upcoming articles.

What is the best way for yield-oriented investors to maximize their returns over the long term while earning solid dividends?

  • Adjust portfolio allocations including higher amounts of BDCs compared to REITs as they have been outperforming over the long and short term.
  • For your REIT allocation please use VNQ which outperforms the average but with a lower yield. VNQ has much better diversification than BIZD/BDCZ.
  • If you are investing for higher total returns especially in a rising rate and/or inflationary environment it’s likely better to invest in higher quality BDCs.
  • If you are investing mostly for higher yield it’s better to use a typical/average BDC vs. mREITs.
  • For the same amount of income with less risk, it’s better to invest 50% less capital in BDCs at 8.3% compared to equity REITs at 3.1% to 3.6%.
  • Do not use BIZD or BDCZ to invest in the BDC sector as they continually underperformed the average BDC. You could pick five random BDCs and easily have higher returns and likely higher yield due to fees.
  • Mortgage REITs are likely not good long-term holdings but can provide higher yields and returns if traded correctly. REM is lower yield but could also reduce the risk for that sector.
  • Investors can easily make higher returns by taking advantage of pricing volatility.

Full BDC Reports

  • Weekly BDC Sector Update – Before the markets open Monday morning we provide quick updates for the sector including significant events for each of the companies that we follow along with upcoming earnings, reporting, and ex-dividend dates. Also, we provide a list of the best-priced opportunities along with oversold/overbought conditions, what to look for in the coming week, and any other meaningful economic events that need to be considered for the sector.
  • Deep Dive Projection Reports – Detailed reports on 2 to 3 BDCs per week prioritized by first focusing on potential issues such as dividend coverage and/or portfolio credit quality changes. We look for portfolio updates that might be mentioned in the SEC filings as compared to company announcements. Then, reports are prioritized based on pricing opportunities including equity offerings.

This information was previously made available to subscribers of Premium BDC Reports. BDCs trade within a wide range of multiples driving higher and lower yields mostly related to portfolio credit quality and dividend coverage potential (not necessarily historical coverage). This means investors need to do their due diligence before buying.
 

PNNT Quick Update: Starting To Pull Back

The following information was previously provided to subscribers of Premium BDC Reports along with:

  • PNNT target prices/buying points
  • PNNT risk profile, potential credit issues, and overall rankings
  • PNNT dividend coverage projections and worst-case scenarios


Summary

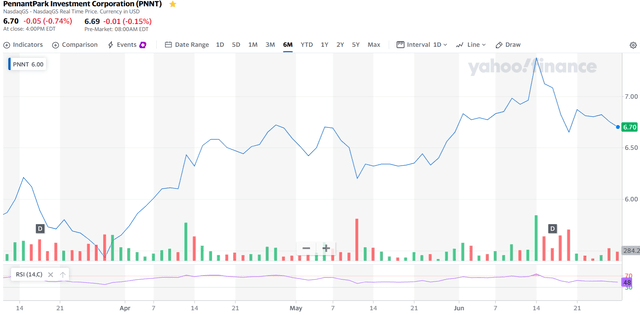
  • PNNT is currently considered a ‘Hold’ but has started to pull back and we thought that this might be a good time to provide a quick update.
  • I am expecting $26 million or $0.39 per share of realized gains during calendar Q2 2021 related to the exit of its equity position in Wheel Pros.
  • On June 3, 2021, its portfolio company Cano Health (CANO) closed its combination with JWS with PNNT’s shares publicly tradable in December 2021.
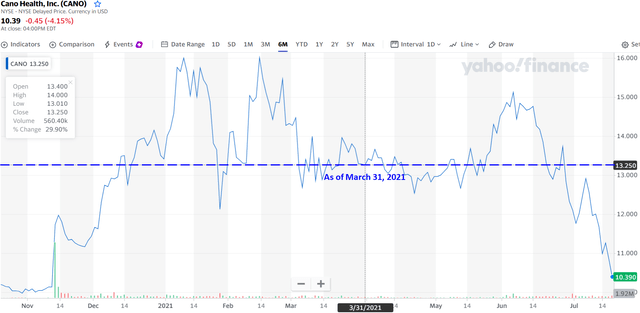
  • However, CANO has declined by around 9% through June 30, 2021, and down another 14% through July 19, 2021, which will drive unrealized losses likely offset by other investments.
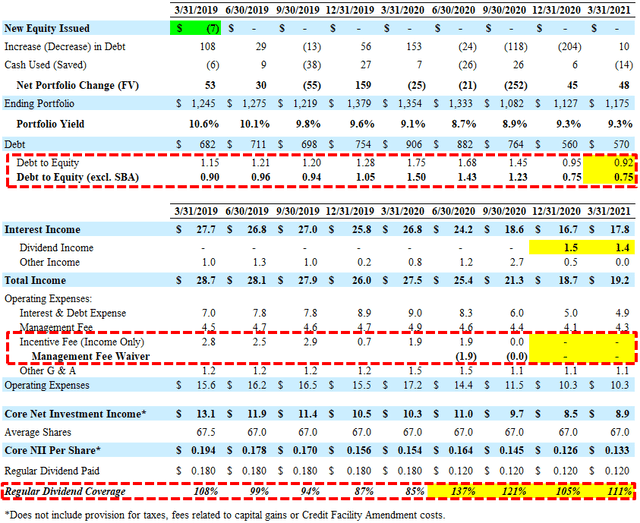
  • PNNT previously reported results last month between its base and best case projections with ‘core NII’ of $0.133 per share and 111% coverage of the quarterly dividend.
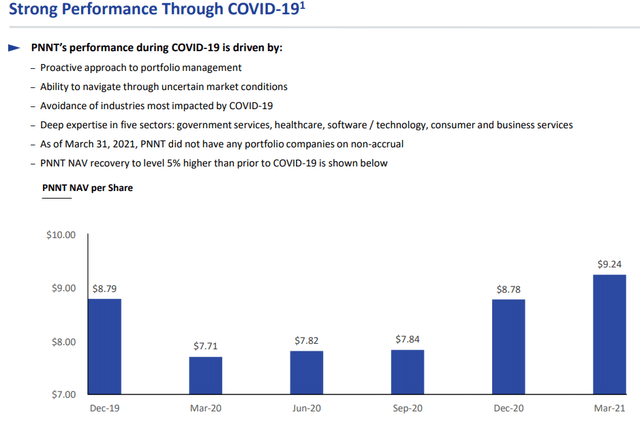
  • As expected its NAV per share grew by another 5.2% mostly due to equity investments driving PNNT’s leverage (debt-to-equity) well below historical levels (0.75 net of SBA debentures).
  • The company has started exiting some of its non-income-producing assets which will likely be reinvested into “yield generating debt instruments”.
  • There was a slight decline in income from its recently formed joint-venture PSLF but is expected to grow over the coming quarters.


PNNT Dividend, NAV Per Share & Management Fees Update

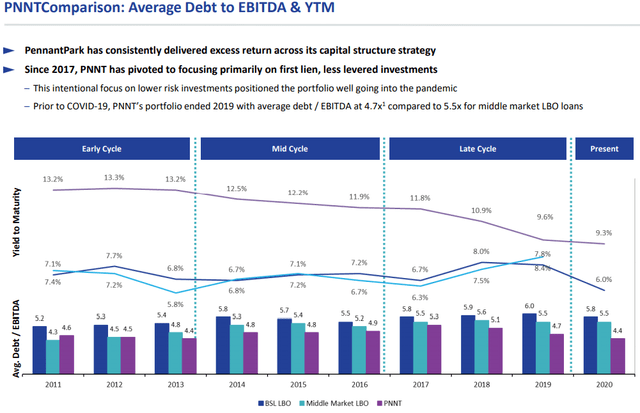
PNNT continues to improve dividend coverage partially due to its previous and upcoming increases in its net asset value (“NAV”) per share combined with its 7% hurdle, the eventual selling and reinvesting of many of its equity positions, and its new joint-venture PennantPark Senior Loan Fund (“PSLF”) with Pantheon Ventures that will likely improve its portfolio yield and risk-adjusted returns.

“With regard to income generation, we have the opportunity to rotate out of our out of our equity investments over time and into yield instruments. In addition, we have the ability to grow the P&L balance sheet, and that of our PSLF JV with Pantheon, which should also generate additional income for the company. Our goal is to fully extend the existing JV and we have a little bit of room to go there. And then you know, subject to pantheons approval of course, in partnership, we be totally open to expanding that JV optimizing it if you look at what’s going on over PFLT our sister company with Kemper. We’ve grown that JV, we’re growing more, we’ve optimized the financing by doing a CLO transaction to get a higher ROI.”

“We have several portfolio companies in which our equity investments have materially appreciated in value as they’re benefiting from the recovery. This is solidifying and bolstering our NAV. As part of our business model, alongside the debt investments we make we selectively choose to co invest in the equity side by side with a financial sponsor. Our returns on these equity investments have been excellent over time. From inception through March, 31, our $226 million of equity investments have generated an IRR of 28% and a multiple on invested capital of 2.9 times. We are pleased that we have significant equity investments in five of these companies, which can substantially move the needle of our NAV. I would like to highlight those five companies, they are Cano, Wheel Pros, Walker Edison, PT Network, and JF Petroleum. As of March 31, PNNT owned equity securities, with a cost and fair market value of $40 million and $43 million, respectively. These companies are gaining financial moment in this environment, and our NAV should be solidified to bolster from these substantial equity investments as their momentum continues. Additionally, we are pleased with a liquidity event that Wheel Pros and Walker Edison, which are a solid start to our equity rotation program.”

I am expecting almost $26 million or $0.39 per share of realized gains during calendar Q2 2021 related to the exit of its equity position in Wheel Pros as discussed on the recent call:

“Wheel Pros is the largest national distributor of aftermarket custom wheels. Our equity position has a cost of $500,000 and a fair market value of $26.4 million as of March 31. At the end of March, the company announced a strategic transaction with the new sponsor investment vehicle, which will result in the full exit of our investment in Wheel Pros. The transaction is expected to close in the next couple of weeks. This will resolve in our equity investment in Wheel Pros, generating an IRR of 104% and a multiple on invested capital of seven times.”

On June 3, 2021, its portfolio company Cano Health, Inc. (CANOclosed its business combination with Jaws Acquisition Corp (“JWS”). As shown in the following table, this investment is marked well above cost and could result in $70.4 million or $1.05 per share of realized gains if sold at the previous fair value.


However, the stock price for CANO has declined by around 9% from March 31, 2021, through June 30, 2021, and down another 14% through July 19, 2021, which will drive unrealized losses likely offset by appreciation from other portfolio equity positions.

Also, there is a six-month lock-up on its shares with 20% of the exit proceeds paid to the financial sponsor and a 6% illiquidity discount applied to the valuation for the March 31, 2021, results. Management discussed Cano Health on the recent call:

“Cano health is a national leader in primary health care who is leading the way in transforming healthcare to provide high quality care at a reasonable cost to a large population. Our equity position as a cost and fair market value on March 31, of $2.5 million and $73 million respectively. We believe that there’s a massive market opportunity for Canada to grow in the years ahead with a Medicare Advantage program and merger with Jaws acquisition is scheduled to close in June. At that time, we will receive another $6.7 million in cash and 6,629,953 shares of Cano health and limited partnership controlled by a financial sponsor where the sponsor will earn 20% of the exit proceeds, the shares will be locked up for six months. From a valuation perspective due to the lockup, the independent valuation firm valued the position with a 6% illiquidity discount to traded value on March 31.”

There is a good chance that PNNT will be selling its equity positions in PT Networks, and Walker Edison Furniture over the next 12 to 18 months. These investments along with the previously discussed Wheels Pros were marked up again and now account for almost $91 million or 7.7% of the portfolio with the proceeds to be reinvested into income-producing assets. As shown in the table below, these investments are marked well above cost and will likely result in a total of $65 million or $0.97 per share of realized gains.


Management discussed these investments on the recent call mentioning additional NAV upside as well as increased earning potential through reinvestment:

“As of March 31, equity represented approximately 36% of the portfolio. Over 60% of this 36% has come from appreciation over the last 12 months driven by many of the companies previously mentioned. Our long term goal continues to target that percentage down to about 10% of the portfolio. As we monetize the equity portfolio, we’re looking forward to investing the cash into yielding debt in investments to increase Net investment income.”

Q. “The long term goal, to get equity, obviously, non equity down to 10%. What’s a realistic timeframe to achieve that goal? I mean, there’s that three years out, is it going to take longer than and it’s certainly not going to happen in 12 months?”

A. “Certainly not a year and, and hopefully not three years. You know, you’re right. I mean, I don’t know if that’s a tight enough band for you. Some of these we control some of these we don’t control we control RAM, to some extent, but we don’t control where the oil and guess M&Amarket is, when the oil and gas M&Amarket starts to heat up. We will meet in a hopefully more action RAM, we do control PT, pivot. And that that, you know, is more in our control in that market strong. So that may be you know, sooner rather than later, does that mean 12 months or 18 months, it’s kind of something in that zone. We don’t control Cano. We don’t control Walker Edison, etcetera. So, you know Cano going through the dispatch process, hopefully in the next month or six weeks. We said well control it after it does the [indiscernible] back but at least it’s more and more on its way to a liquidity event. That’ll be a big milestone. So yes, a year to three years just as a general you know, if you really want to say let’s run the table, get it down to 10%. I think that’s probably right.”

“Walker Edison is a leading e-commerce platform focused on selling furniture exclusively online through top ecommerce companies, our equity position as a cost of 1.9 million and a fair market value of $16.7 million as of March 31. Shortly after quarter and the company executed a refinancing and dividend recap, which resulted in shareholders receiving two times their costs while maintaining the same ownership in the company. This resulted in PNNT receiving a $3.8 million cash payment on his equity position.”

Q. “On Walker Edison you mentioned that $3.8 million cash payment, what should we expect, say half of that to be recognized as dividends and maybe the other half to be returned to capital and take your cost basis down to zero or with the whole thing, the dividend?”

A. “It’ll be based on what we could tell it’ll be the first obviously the first part of its return on capital. And the second part of it looks like it’s can be counted as a capital gain.”

“PT Network is the leading physical and occupational therapy provider in the Mid-Atlantic states. Our equity investment in PT came through a restructuring which came about after the company made several operational mistakes. We’ve always had a positive view of the industry and the outlook to the industry tailwinds and demographics, which results in comparable companies trading at EBITDA multiples of 12 to 15 times. Under our ownership, we brought in an excellent management team who corrected those operational mistakes and has shepherded the company well through COVID. Our equity position as a cost of $23 million, and the fair value of $48 million as of March 31.”

My primary concerns for PNNT are mostly related to the recent increase in payment-in-kind (“PIK”) interest income from 13.0% to 20.3% of total income over the last two quarters and the commodity-related exposure combined lack of a “total return hurdle” incentive fee structure to protect shareholders from capital losses. However, management consistently “does the right thing” including continued fee waivers and previously reducing its base management (from 2.00% to 1.75%) and incentive fees (from 20.0% to 17.5%).


PNNT March 31, 2021, Quick Update

PennantPark Investment (PNNT) reported between its base and best case projections with ‘core NII’ of $0.133 per share and 111% coverage of the quarterly dividend adjusting for $0.2 million provisions for taxes. There was a slight decline in interest and dividend income from its recently formed joint-venture PennantPark Senior Loan Fund (“PSLF”) but is expected to grow over the coming quarters. Also the company has started exiting some of its non-income-producing assets which will likely be reinvested into “yield generating debt instruments”:

Art Penn, Chairman/CEO: “We are pleased with the substantial increase in NAV this past quarter due to material appreciation in the value of several equity investments. We believe that we can generate increased income over time by rotating those equity positions into yield generating debt instruments. We are starting to see some progress on the exit of those equity investments. Additionally, we have the ability to grow the PNNT balance sheet and our PSLF JV which should also generate additional income for the Company.”

As expected its NAV per share grew by another 5.2% mostly due to equity investments driving PNNT’s leverage (debt-to-equity) well below historical levels (0.75 net of SBA debentures) giving the company plenty of growth capital for increased earnings potential.

For additional detail about PNNT including dividend coverage potential and risk profile, please read “PNNT Updated Projections/Pricing: Dividend Increases Coming“.  We will update this report next month.


Full BDC Reports

This information was previously made available to subscribers of Premium BDC Reports. BDCs trade within a wide range of multiples driving higher and lower yields mostly related to portfolio credit quality and dividend coverage potential (not necessarily historical coverage). This means investors need to do their due diligence before buying.
Quick Preview: “The Worst Way to Invest the BDC Sector: BIZD & BDCZ”

The following information was previously provided to subscribers of Premium BDC Reports along with target prices, dividend coverage and risk profile rankings, earnings/dividend projections, quality of management, fee agreements, and my personal positions for all Business Development Companies (“BDCs”).


BDC Sector ETFs/ETNs

I have recently noticed increased attention to using BIZD and BDCZ as investment vehicles for the BDC sector and I will discuss these in an article titled “The Worst Way to Invest the BDC Sector” later this week.

To start, BDCs are relatively new and a small sector compared to REITs so there are not many companies that provide sufficient trading volumes or market cap to create a quality ETF/ETN. Their allocations are terrible and currently have 11% to 15% in FSK, 5% to 6% in PSEC, and another 30% to 35% in other companies that might be adequate quality but currently overpriced and I would not recommend at these levels. But the worst part is that these investments (BIZD/BDCZ) somehow find a way to underperform not just the average BDC but also their specific allocations which must be due to poor management including fees and ‘adjustments’. I have gone through a quarterly analysis using their exact allocations and not able to tie the results as they are usually lower by around 2% annually.

I’m not a fan of using calendar dates to track BDC returns because most people who invest in this sector take advantage of volatility and no one was buying on December 31, 2019, as BDC prices were near new highs at the time. But it is a way to compare returns over a certain time period and the following tables show how much BIZD/BDCZ have underperformed the average.

It should be noted that FSK, MAIN, and AINV have lower performance for the reasons discussed in  previous updates:


Below are the updated equity and mortgage REIT returns compared to VNQ and REM in the following table which have seriously underperformed the average BDC over the last 18 months.


Full BDC Reports

  • Weekly BDC Sector Update – Before the markets open Monday morning we provide quick updates for the sector including significant events for each of the companies that we follow along with upcoming earnings, reporting, and ex-dividend dates. Also, we provide a list of the best-priced opportunities along with oversold/overbought conditions, what to look for in the coming week, and any other meaningful economic events that need to be considered for the sector.
  • Deep Dive Projection Reports – Detailed reports on 2 to 3 BDCs per week prioritized by first focusing on potential issues such as dividend coverage and/or portfolio credit quality changes. We look for portfolio updates that might be mentioned in the SEC filings as compared to company announcements. Then, reports are prioritized based on pricing opportunities including equity offerings.

This information was previously made available to subscribers of Premium BDC Reports. BDCs trade within a wide range of multiples driving higher and lower yields mostly related to portfolio credit quality and dividend coverage potential (not necessarily historical coverage). This means investors need to do their due diligence before buying.

Upcoming BDC Ex-Dividend Dates: June 15, 2021

The following information was previously provided to subscribers of Premium BDC Reports along with target prices, dividend coverage and risk profile rankings, earnings/dividend projections, quality of management, fee agreements, and my personal positions for all Business Development Companies (“BDCs”).


Recent & Upcoming Ex-Dividend Dates

  • TPVG, MRCC, NMFC,  and TCPC all have ex-dividend dates of June 15, 2021, which means that their prices will be around 2% lower (shown below) at the open of the markets this morning and could be a buying opportunity.
  • AINV, PFLT, PNNT, GAIN, and GLAD also have ex-dividend dates this week.
  • Please keep in mind tax considerations (income versus capital gains) and it might be a good idea to wait until the morning of the ex-dividend date to make additional purchases.

BDC Ex-Dividend Dates


Full BDC Reports

This information was previously made available to subscribers of Premium BDC Reports. BDCs trade within a wide range of multiples driving higher and lower yields mostly related to portfolio credit quality and dividend coverage potential (not necessarily historical coverage). This means investors need to do their due diligence before buying.
MAIN Quick Update: Upcoming Realized Gain

The following information was previously provided to subscribers of Premium BDC Reports along with:

  • MAIN target prices/buying points
  • MAIN risk profile, potential credit issues, and overall rankings
  • MAIN dividend coverage projections and worst-case scenarios


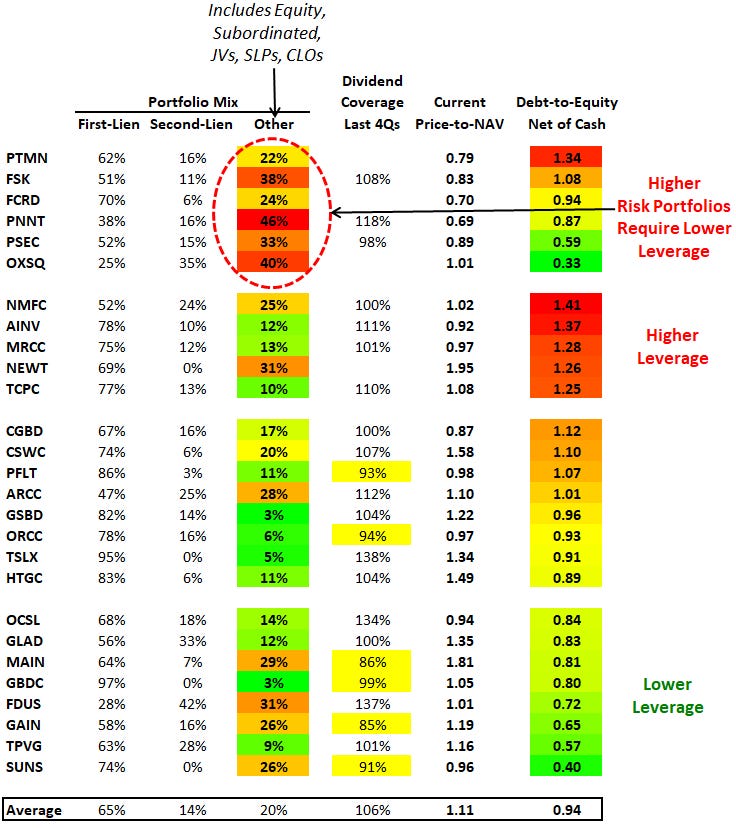
As mentioned earlier this week in the “Updated BDC Dividend Coverage Levels”, most dividend coverage measures for BDCs use net investment income (“NII”) which is basically a measure of earnings. However, some BDCs achieve incremental returns typically with equity investments that are sold for realized gains often used to pay supplemental/special dividends. These BDCs include MAIN, GAIN, CSWC, PNNT, TPVG, HTGC, and TSLX.

Yesterday, MAIN announced that it recently exited its equity investment in American Trailer Rental Group (“ATRG”) which is a leading provider of trailer rental solutions to manufacturing, distribution, and third-party logistics (3PL) customers. MAIN realized a gain of $17.0 million on the exit of its equity investment in ATRG, with this realized value representing an increase of $7.8 million above MAIN’s fair market value for this investment as of March 31, 2021:

On a cumulative basis since Main Street’s initial investment in ATRG in June 2017, Main Street realized an internal rate of return of 60.9% and a 3.0 times money invested return on its equity investments in ATRG. On a cumulative basis including both Main Street’s debt and equity investments, Main Street realized an annual internal rate of return of 28.1% and a 1.7 times money invested return on its aggregate debt and equity investments in ATRG.

There will be around $0.25 per share of realized gains as well as a slight increase in NAV per share of around 0.5% related to the exit of ATRG. Management was expecting distributable net investment income of $0.59 to $0.62 per share for Q2 2021 compared to the regular dividends of $0.615 so this should be considered good news. However, the market did not respond to the news, and MAIN’s stock was down slightly (by 0.4%) yesterday likely due to the previous net realized losses that need to be taken into account including $15.7 million during Q1 2021. Also, the company does not typically does not announce exits that include losses so we need to wait and see the full quarter results. I will be updating the MAIN Projections & Pricing report later this month taking into account all changes to portfolio credit quality and expected dividend coverage which should continue to improve as discussed in the MAIN Q1 2021 Quick Update from last month as well as management on the recent call:

Based upon our results for the first quarter and the positive developments we have seen in our existing portfolio companies, coupled with the future benefits of our growing asset management business, the attractive new investment opportunities we are seeing in our lower middle market and private loan strategies, our efficient operating structure and strong liquidity position, we remain confident with our expectations for continued improvement in our DNII per share in 2021 and our expectation to resume consistently generating DNII in excess of our monthly dividends later this year, followed by the eventual growth of our monthly dividends, consistent with our long-term historical practices prior to the onset of the pandemic.”


Full BDC Reports

This information was previously made available to subscribers of Premium BDC Reports. BDCs trade within a wide range of multiples driving higher and lower yields mostly related to portfolio credit quality and dividend coverage potential (not necessarily historical coverage). This means investors need to do their due diligence before buying.
 

HTGC Distribution Update: Continued Supplementals

The following information was previously provided to subscribers of Premium BDC Reports along with:

  • HTGC target prices/buying points
  • HTGC risk profile, potential credit issues, and overall rankings
  • HTGC dividend coverage projections and worst-case scenarios


HTGC Distribution Update

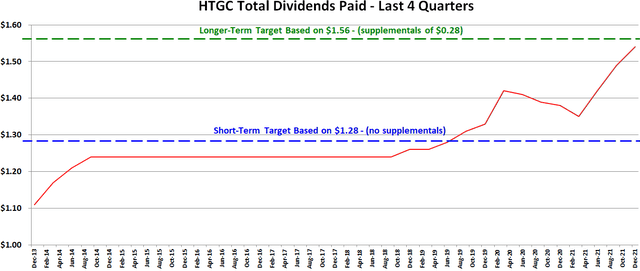
As predicted in previous updates, HTGC declared additional supplemental cash distributions during 2021 due to the “record level of spillover at $0.94” and “the trajectory of the business for the course of 2021”. HTGC will be distributing $0.28 per share (more than I was expecting) evenly over the next four quarters starting with $0.07 per share for the first quarter of 2021 paid in May 2021.

“I would also like to discuss our supplemental shareholder distribution Program for fiscal year 2021. In addition to our ninth consecutive quarterly cash distribution of $0.32 per share, we are also declaring a supplemental distribution of $0.28 per share for fiscal 2021, which will be distributed equally at $0.07 per quarter for the next four quarters, beginning with the first quarter distribution payable in May 2021. One of our goals was to establish a policy for 2021 that provided a little bit more clarity and continuity to our shareholders with respect to that base distribution. We thought that the $0.28 was an appropriate number given two things. Number one, we are still sitting on a record level of spillover at $0.94. And number two, our competence in the trajectory of the business for the course of 2021. And based on those two things, we thought that it was more appropriate for us to declare the $0.28 give our shareholders sort of consistency and comfort that it would be $0.07 per quarter versus what we’ve done for the last two years, which is in six of the eight quarters declares a supplemental distributions on a quarterly basis. This just provides a little bit more visibility and a little bit more clarity to our shareholders, which we think is an important thing to do. As of Q1, 2021, we have generated undistributed earnings spillover of approximately $109.1 million or $0.94 cents per share, subject to final tax filings. This provides us with additional flexibility with respect to our variable base distribution going forward, and the ability to continue to invest in our team and platform.”


HTGC remains a higher dividend coverage BDC with the potential for supplemental dividends partially due to its internally-managed cost structure and equity investments historically providing realized gains and supporting supplemental dividends:

“Our warrant and equity portfolio is designed to provide potential upside returns to our shareholders above and beyond our net investment income, as well as mitigate potential debt losses that may occur. As of Q4 2020, we have generated undistributed earnings spillover of approximately $107.7 million or $0.94 per share, subject to final tax filings. This provides us with additional flexibility with respect to our variable base distribution going forward and the ability to continue to invest in our team and platform.”

HTGC maintains a “variable distribution policy” with the objective of distributing four quarterly distributions in an amount that approximates 90% to 100% of the company’s taxable quarterly income or potential annual income. In addition, the company pays additional supplemental distributions to distribute approximately all its annual taxable income in the year it was earned, or it can elect to maintain the option to spill over the excess taxable income into the coming year for future distribution payments.

“We have a variable dividend policy, so it’s something that the Board evaluates on a quarterly basis, and we don’t just look short-term, we look long-term when we’re making those decisions. We’ve been very clear in terms of our public guidance on the last several calls that we see absolutely no risk to that $0.32 base distribution, and we would reiterate that guidance on this call now. If you think about what we’ve been able to do in terms of the special distributions, we’ve been able to deliver to our shareholders a supplemental or a special distribution in six of the last seven quarters on top of the $0.32 base distribution. And obviously, subject to market conditions, I think one of the things that we’re going to look at near-term here is trying to find a way to provide a little bit more consistency and continuity to those supplemental distributions. “


Hercules Adviser LLC Update

On March 25, 2021, HTGC announced that Hercules Adviser LLC, a wholly-owned subsidiary of HTGC, had successfully closed its inaugural institutional private credit fund.

Scott Bluestein, CEO and CIO of HTGC: “We are very pleased to announce that Hercules Adviser has successfully raised and closed its first institutional private credit fund. This new private credit fund will allow us to continue to expand and broaden our investment platform while at the same time serving the growing needs of the venture and growth stage companies that we seek to partner with.”

Management has mentioned that this will allow the company to “expand and broaden” its investment platform allowing HTGC to access to “a lot of deals that we’re now able to do at the BDC level”. However, as the fund ramps up it will likely be “taking some investments away” over the short-term and sharing expenses reducing HTGC’s operating costs as well as eventually paying distributions to HTGC as “100% of the benefit from the RIA activities accrues and accretes to the shareholders of the public BDC”.

“After establishing Hercules Advisor as a wholly own registered investment advisor in 2020, we are very pleased to have raised and closed our first institutional private credit fund. Having this first fund and potentially future funds gives us the opportunity to expand and diversify our investment platform while enhancing our level of service and capabilities to our current and future venture growth stage companies. While we anticipate that it will take time to ramp up our activities under our RIA, we do expect that over the short term, Hercules Capital will benefit from being able to share certain expenses with Hercules Advisor and having a more diverse platform for the funding of new investments. Longer term and subject to the ultimate performance and size of the funds managed by Hercules Advisor, we expect Hercules Capital to potentially benefit from distributions from the advisor as that business ramps up.”

“On an initial basis as it ramps up potentially taking some investments away with the two caveats that we mentioned before. Number one, there are a lot of deals that we’re now able to do at the BDC level that we probably could not otherwise have done. If we didn’t have the private vehicle to be investing alongside us. And then no two, this is not an externally managed private fund. This is a private fund that’s managed by a wholly owned RIA. So 100% of the benefit from the RIA activities accrues and accretes to the shareholders of the public BDC. During Q1 we successfully closed our first private fund, and as a result, we allocated a portion of certain commitments and fundings to the initial private fund. This also allowed us to allocate certain expenses to Hercules Advisor, our RIA managing the private fund during the quarter.”


HTGC March 31, 2021, Results

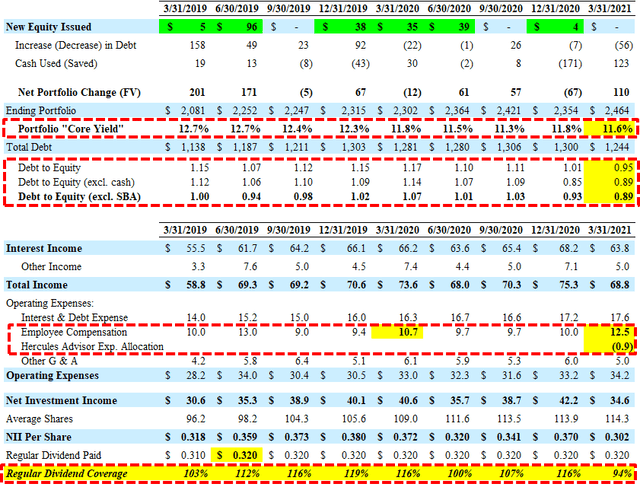
Hercules Capital (HTGC) reported just above its base case projections for Q1 2021 not fully covering its dividend (as expected). However, the company had around $0.94 of undistributed income for temporary shortfalls and has covered its dividend by an average of 110% over the last 8 quarters supporting the previously announced supplemental dividends. Also, as mentioned in the previous report, there were higher expenses related to payroll tax in Q1:

“SG&A expenses increased to $17.6 million from $16 million in the prior quarter. The increase was driven by higher compensation expenses related to the increase in fundings and first quarter payroll taxes which normally run higher in the first quarter. Net of truck costs recharged to the RIA, the SG&A expenses were $16.7 million. For the second quarter, we expect SG&A expenses of $16 million to $17 million slightly below the prior quarter, as Q1 always has higher employer payroll taxes. We expect our second quarter borrowing costs to decrease modestly.”

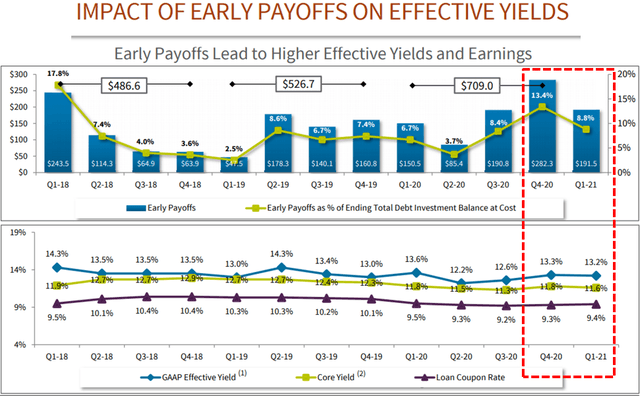
The effective yield was 13.2% during Q1 2021, down slightly compared to 13.3% for Q4 2020 due to lower early loan repayments (discussed next). Effective yields generally include the effects of fees and income accelerations attributed to early loan repayments and other one-time events. HTGC’s ‘Core Yield’ decreased from 11.8% to 11.6% and over 98% of its debt portfolio is now at its contractual interest rate floor.

“The decline in both total investment income and net investment income was consistent with our guidance, and due to the lower debt portfolio balance attributable to the record Q4 payoffs, and lower fee income as a result of a lower level of prepayments during the first quarter. Core yield, a non-GAAP measure, was 11.6% during Q1 2021, within the Company’s expected range of 11.0% to 12.0%, and decreased slightly compared to 11.8% in Q4 2020. Hercules defines core yield as yields that generally exclude any benefit from income related to early repayments attributed to the acceleration of unamortized income and prepayment fees and includes income from expired commitments. During Q1, we continue to see strength in terms of portfolio company exits, and portfolio company liquidity events. This combined with continued very strong performance across our portfolio, again drove high levels of early pay-offs. Early loan repayments were at the high end of our guidance of $150 million to $200 million at over $191 million, but decreased from $282 million in Q4.”

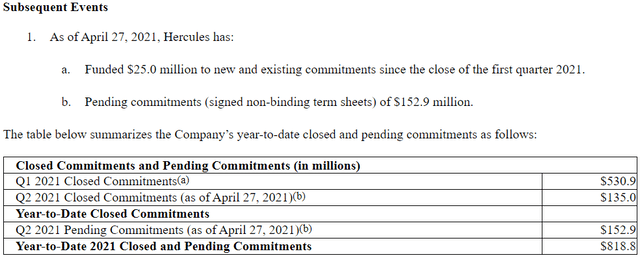
HTGC ended Q1 2021 with $550 million of available liquidity, including $75 million in unrestricted cash and cash equivalents, and $475 million in available credit facilities. HTGC had pending commitments of $153 million as of April 27, 2021, and since the close of Q1 2021, the company has closed new debt and equity commitments of $135 million and funded $25 million.

“For Q2, we again expect prepayments to be between $150 million and $200 million, although this could change materially as we progress in the quarter.”

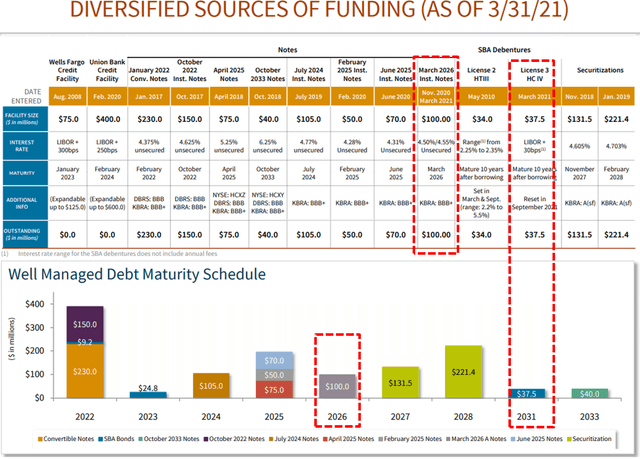
In March 2021, the company issued an additional $50 million 4.50% Notes due March 2026 and $50 million 4.55% Notes due March 2026.

“Our leverage includes the March issuance of $50 million five-year notes in a private placement with a fixed coupon of 4.55%. This was the second tranche of the arrangement announced in November 2020, totaling up $100 million in private placement financing.

In October 2020, the company announced that it had received approval for its third SBA license. It should be noted that this was quicker than expected and will provide an additional $175 million of fixed-rate borrowings at very attractive 10-year rates.

“In addition, we have started to utilize our third SBA license drawing down $37.5 million of debentures and has attractive annual interest rate of 0.77%.”


During Q1 2021, the company did not issue additional shares through its At-the-Market (“ATM”) Equity Distribution Agreement. HTGC continues to target a regulatory debt-to-equity ratio between 0.95 to 1.25 and will likely use the ATM program to maintain leverage while growing the portfolio. As of March 31, 2021, approximately 16.2 million shares remain available for issuance and sale

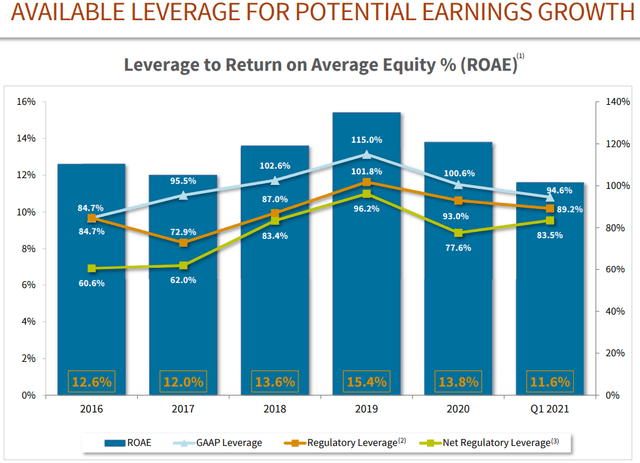
“Moving on to discuss leverage. Our GAAP and regulatory leverage was 94.6% and 89.2%, respectively, which decreased compared to the prior quarter due to the partial repayment of the two securitizations, which are now in runoff. Netting out leverage with the cash on the balance sheet, our GAAP and regulatory leverage was 88.9% and 83.5% respectively, putting us in a very strong position heading into the next quarter.”


Full BDC Reports

This information was previously made available to subscribers of Premium BDC Reports. BDCs trade within a wide range of multiples driving higher and lower yields mostly related to portfolio credit quality and dividend coverage potential (not necessarily historical coverage). This means investors need to do their due diligence before buying.
GSBD Update: Potential July Pullback

The following information was previously provided to subscribers of Premium BDC Reports along with:

  • GSBD target prices/buying points
  • GSBD risk profile, potential credit issues, and overall rankings
  • GSBD dividend coverage projections and worst-case scenarios

This update discusses Goldman Sachs BDC (GSBD) and was previously posted on our new platform with updated target prices, dividend projections, rankings, and recommendations:


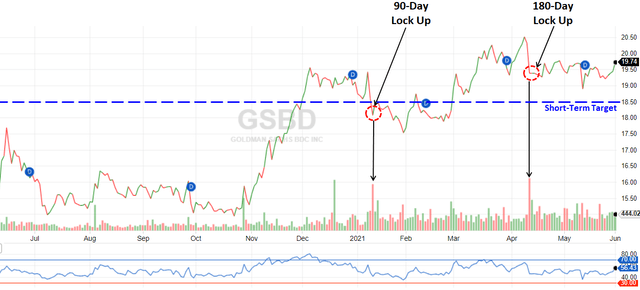
GSBD will likely experience additional selling pressure during the first and second week of July 2021 potentially driving the stock price closer to its ST target of $18.50 and I will send out reminders before the last lock-up expires.

“….upon the closing of the Merger that generally restricted all stockholders who received shares of our common stock in the Merger from transferring their respective shares of our common stock for at least 90 days following the date of the closing of the Merger (the “Closing Date”), subject to a modified lock-up schedule thereafter (lock-up restrictions on 1/3 of the Affected Stockholders’ shares will lapse after 90 days from the Closing Date, lock-up restrictions on an additional 1/3 of the Affected Stockholders’ shares will lapse after 180 days from the Closing Date, and lock-up restrictions on the remaining 1/3 of the Affected Stockholders’ shares will lapse after 270 days from the Closing Date).


GSBD Dividend Coverage Update

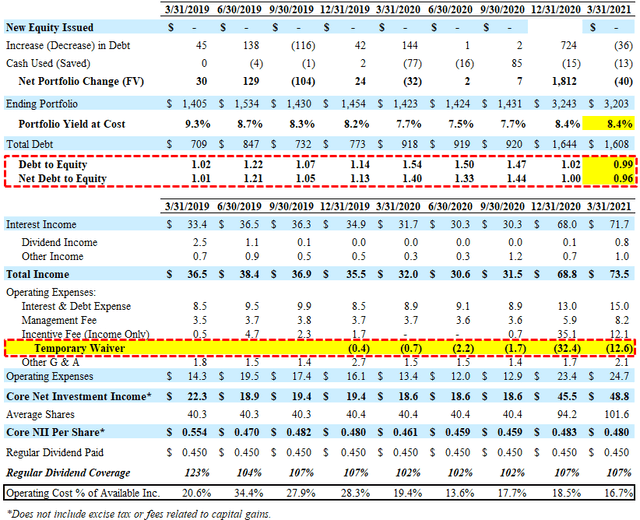
For Q1 2021, GSBD reported slightly above its base-case projections due to higher-than-expected dividend and other income partially offset by lower portfolio growth driving slightly lower interest income. However, leverage (debt-to-equity) declined to a new near-term low giving the company plenty of growth capital for increased earnings potential. GSBD has covered its dividend by an average of 105% over the last 8 quarters growing spillover/undistributed income. Previously, GSAM announced that it will waive a portion of its incentive fee for the four quarters of 2021 (Q1 2021 through and including Q4 2021) for each such quarter in an amount sufficient to ensure that GSBD’s net investment income per weighted average share outstanding for such quarter is at least $0.48 per share.

“The increase quarter-over-quarter was primarily due to the timing of the merger at close in Q4 as well as increased income from GSBD’s historic origination activity during Q4. On a per share basis, GAAP and adjusted net investment income were $0.57 and $0.48 per weighted average share, respectively, as compared to $0.59 and $0.48, respectively, in the fourth quarter of 2020. The per share decrease is the result of an increase in post-merger weighted average shares outstanding.”


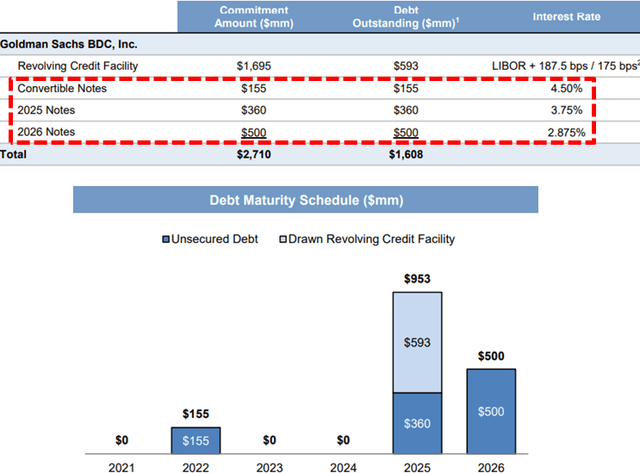
Similar to other BDCs, GSBD has been lowering its borrowing rates as well as constructing a flexible balance sheet including the public offering of $500 million of 2.875% unsecured notes due 2026 (CUSIP: 38147UAD9) in November 2020. Previously, the company issued $360 million of unsecured notes due 2025 at 3.750% (CUSIP: 38147UAC1). As of March 31, 2021, 63% of its borrowings were unsecured with $1.1 billion of availability under its credit facility. Fitch’s reaffirmed GSBD’s investment grade rating of BBB- and revised the outlook to stable.

“At quarter end, 63% of the company’s outstanding borrowings were unsecured debt and $1.1 billion of capacity was available under GSBD’s secured revolving credit facility. Given the current debt position and available capacity, we continue to feel we have ample capacity to fund new investment opportunities with borrowings under our credit facility.”

On October 12, 2020, GSBD completed its merger with Goldman Sachs Middle Market Lending (“MMLC”) which doubled the size of the company including significant deleveraging. This deleveraging creates more capacity to deploy capital into today’s attractive investment environment while adding a greater margin of safety to maintain GSBD’s investment-grade credit rating and comply with regulatory and contractual leverage ratio requirements.

The Board reaffirmed its regular dividend of $0.45 per share payable to shareholders of record as of June 30, 2021. Previously, the company paid a special dividend of $0.05 per share in May 2021 which is the second of its three quarterly installments of special dividends aggregating to $0.15 per share in connection with the merger.


Full BDC Reports

This information was previously made available to subscribers of Premium BDC Reports. BDCs trade within a wide range of multiples driving higher and lower yields mostly related to portfolio credit quality and dividend coverage potential (not necessarily historical coverage). This means investors need to do their due diligence before buying.
SUNS Quick Dividend Coverage Update

The following information was previously provided to subscribers of Premium BDC Reports along with:

  • SUNS target prices/buying points
  • SUNS risk profile, potential credit issues, and overall rankings
  • SUNS dividend coverage projections and worst-case scenarios

This update discusses SLR Senior Investment (SUNS) and was previously posted on our new platform with updated target prices, dividend projections, rankings, and recommendations:


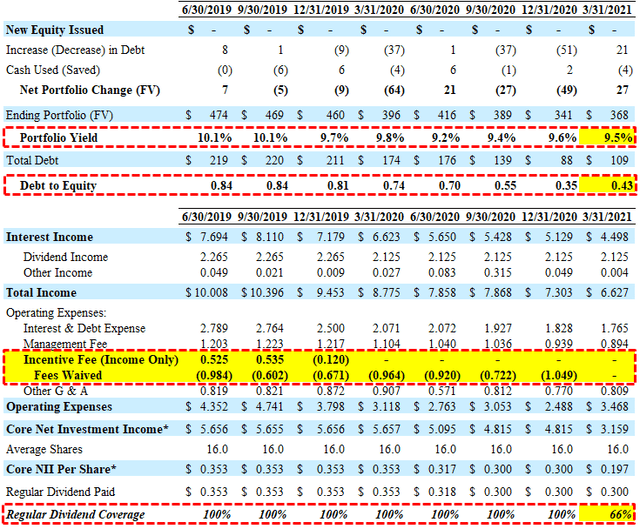
For Q1 2021, SUNS did not fully cover its dividends due to no fee waivers for the quarter combined with being under-leveraged. However, management has guided for portfolio growth given its extremely low leverage with a current debt-to-equity of 0.43 (0.40 net of cash) which is currently the lowest in the BDC sector. Also, management continues to mention the possibility of additional acquisitions:

“The shortfall for the $0.30 per share earned in the prior quarter is a direct result of SUNS being under-invested. At March 31, SUNS significantly under levered at 0.4x net debt to equity relative to our target range of 1.25x to 1.50x. Importantly, the economic climate has improved considerably, and our pipeline across all 4 business verticals is very attractive. We expect portfolio growth in the coming quarters from both first link cash flow and asset-based loan investment opportunities. In addition, we continue to actively pursue acquisition opportunities of specialty lenders operating in niche markets as well as opportunistic ABL portfolio acquisitions.”


Full BDC Reports

This information was previously made available to subscribers of Premium BDC Reports. BDCs trade within a wide range of multiples driving higher and lower yields mostly related to portfolio credit quality and dividend coverage potential (not necessarily historical coverage). This means investors need to do their due diligence before buying.
Copyright © 2018-2025 BDC BUZZ All rights reserved.