The following information was previously provided to subscribers of Premium BDC Reports along with:
- CSWC target prices/buying points
- CSWC risk profile, potential credit issues, and overall rankings
- CSWC dividend coverage projections and worst-case scenarios

Summary
- CSWC will likely continue to increase its regular dividend and pay supplementals as predicted in previous reports.
- I have increased the LT target to take into account additional/continued quarterly increases in addition to the $0.10 supplemental, improved credit quality, and NAV increases.
- The stock is likely overpriced at these levels and I will not be making changes to this position until after updating the CSWC Projections & Pricing report.
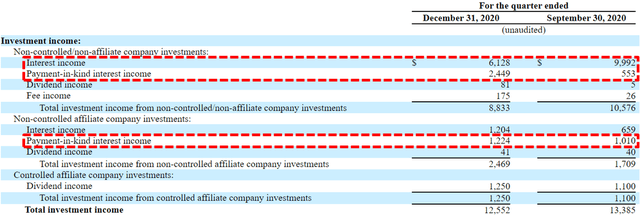
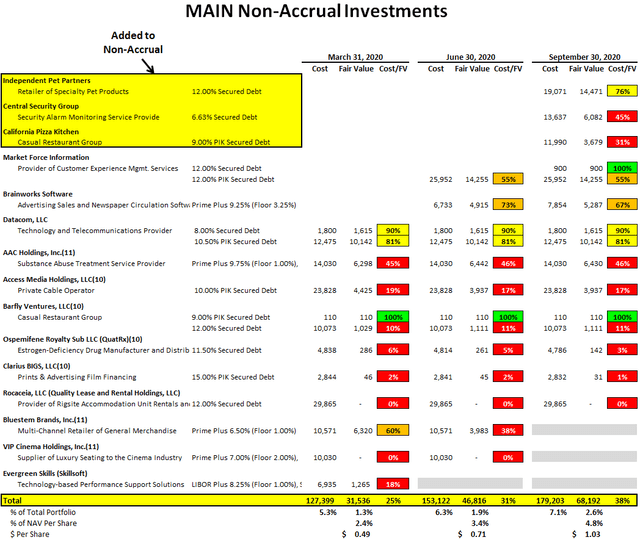
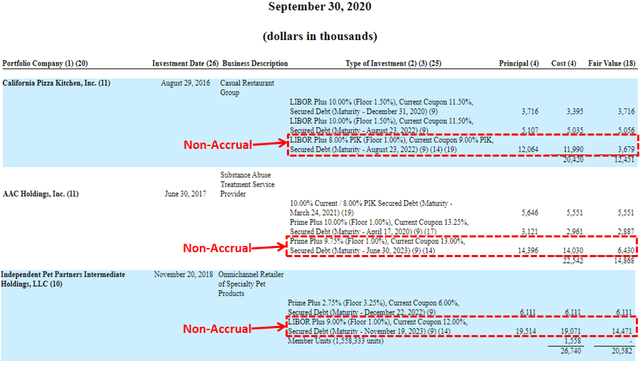
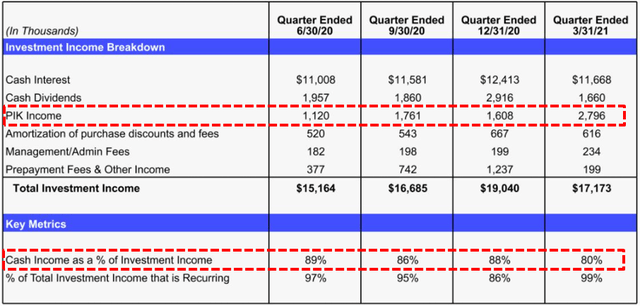
- My primary concern is the recent increase in non-cash PIK income during the quarter from $1.6 million to $2.8 million which could include some one-time items. AGKings was exited and there are no non-accruals.
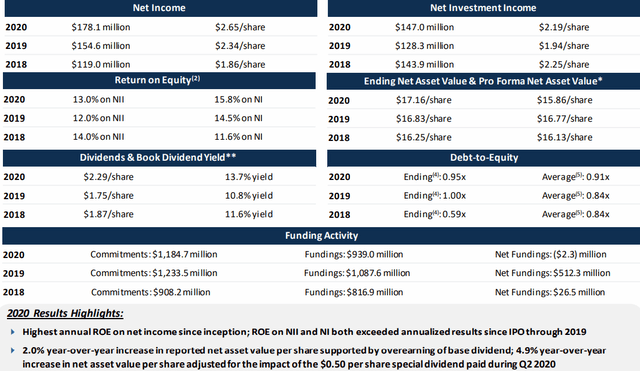
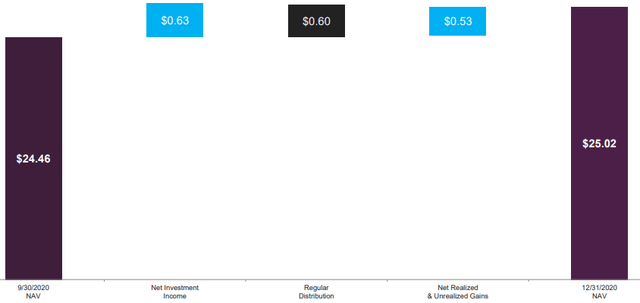
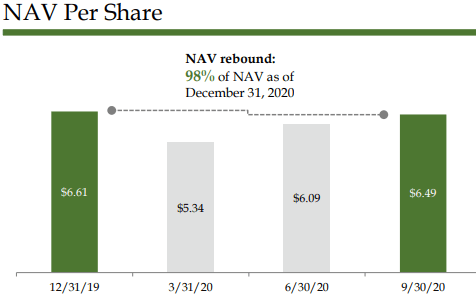
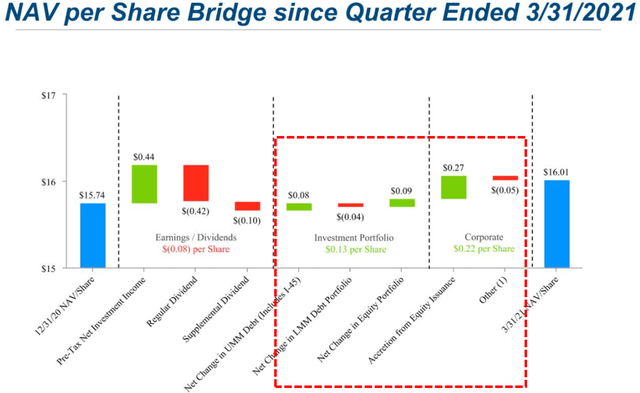
- NAV increased by 1.7% mostly due to accretive share issuances through its ATM program.
CSWC Dividend Coverage Update
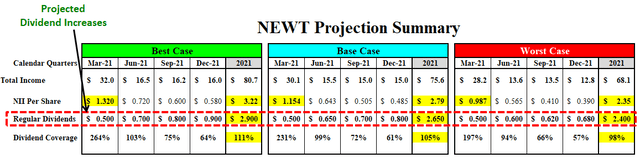
As mentioned in the previous projections “there is a good chance of dividend increases over the coming quarters”.
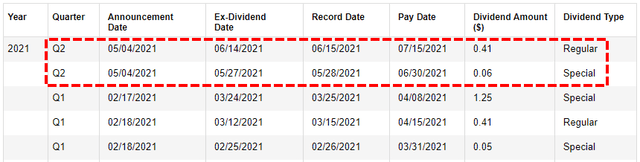
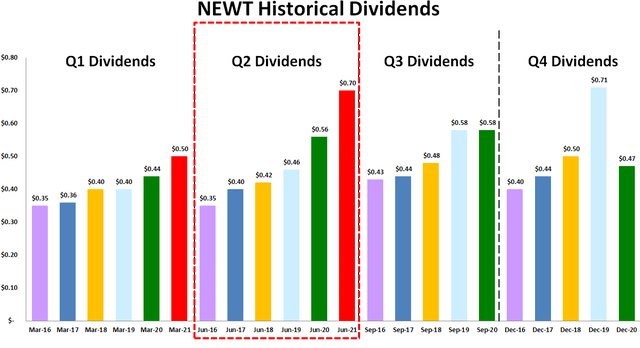
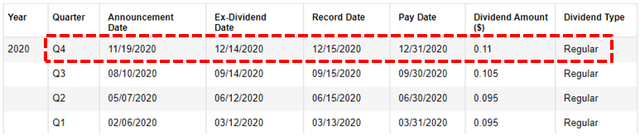
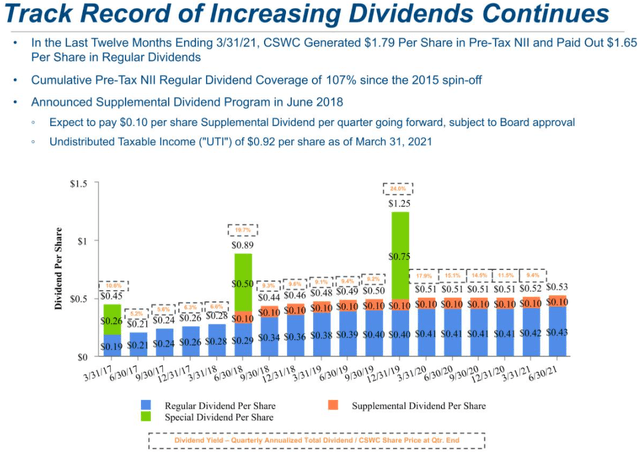
CSWC’s Board declared a total dividend of $0.53 per share for the quarter ended June 30, 2021, including the increased regular quarterly dividend of $0.43 per share (previously $0.42) and a supplemental dividend of $0.10 per share.
“Based on our continued strong performance, the Board of Directors has increased our total dividends to $0.53 per share for the quarter ending June 30, 2021 by increasing our Regular Dividend to $0.43 per share and maintaining our Supplemental Dividend at $0.10 per share.”
- Ex-Dividend Date: June 14, 2021
- Record Date: June 15, 2021
- Payment Date: June 30, 2021
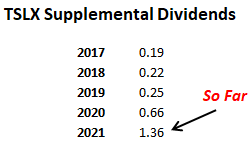
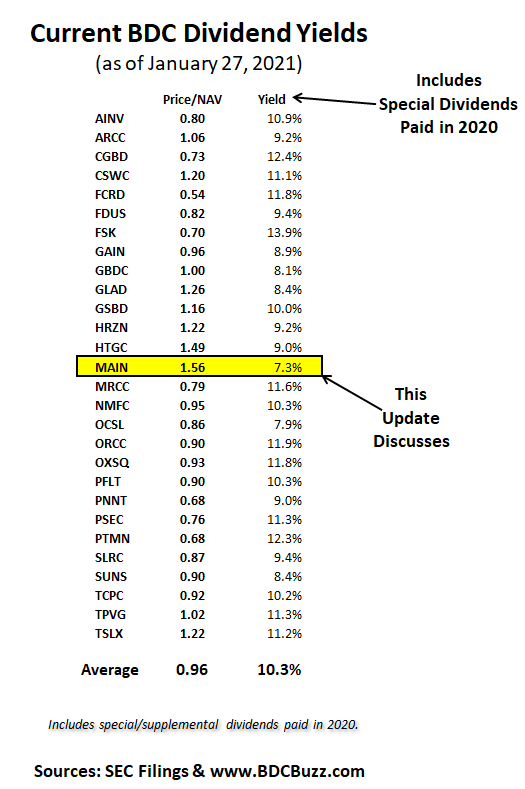
CSWC’s target pricing and dividend yield in the BDC Google Sheets already takes into account $0.10 per share of quarterly supplemental/special distributions that will likely continue beyond 2021. Similar to MAIN, the supplemental dividends are typically covered by realized capital gains and over-earning the regular dividend. As of March 31, 2021, CSWC had $0.92 per share of undistributed taxable income. Management is likely going to maintain its supplemental dividends going forward as they need to distribute UTI over the coming quarters.
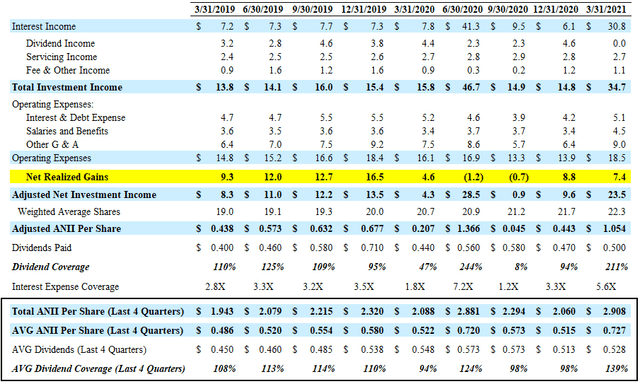
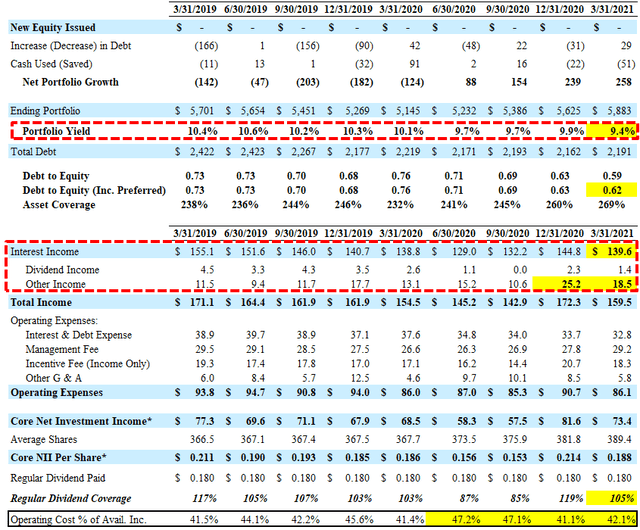
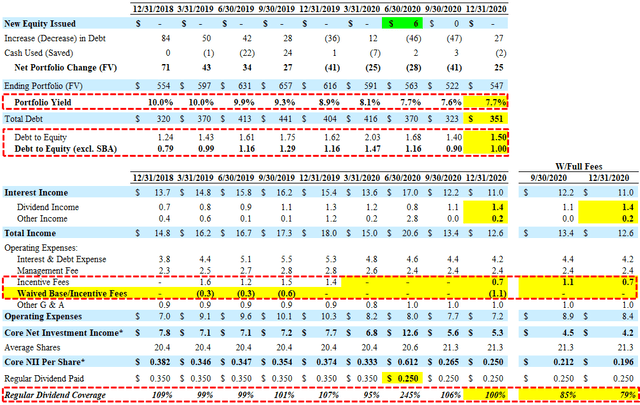
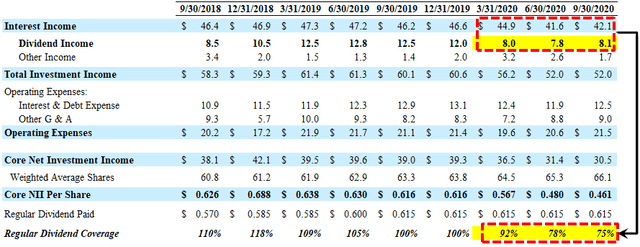
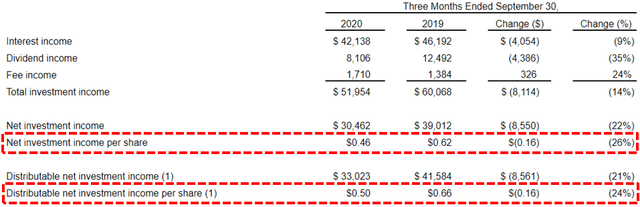
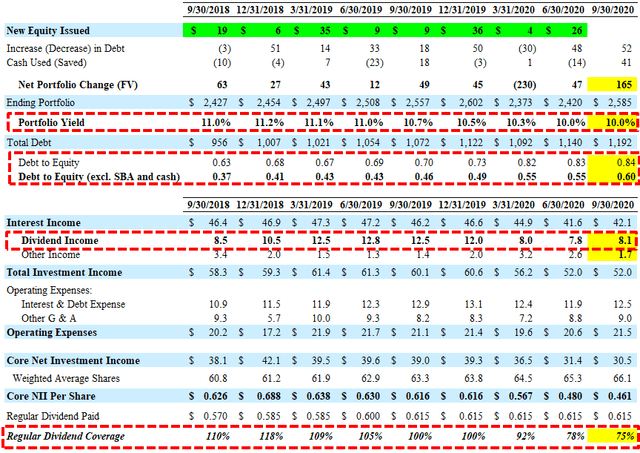
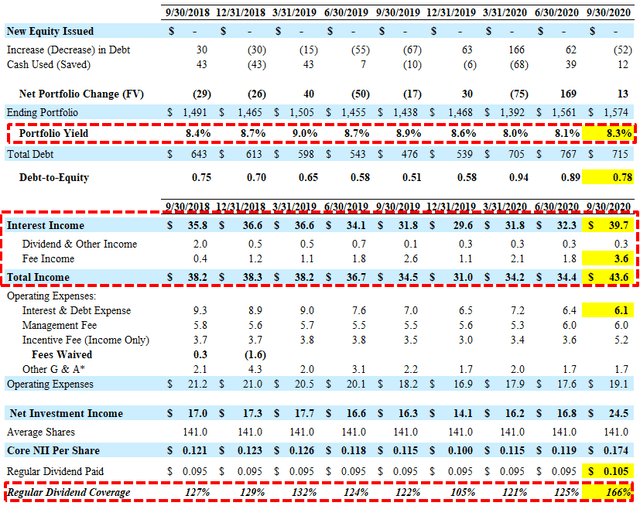
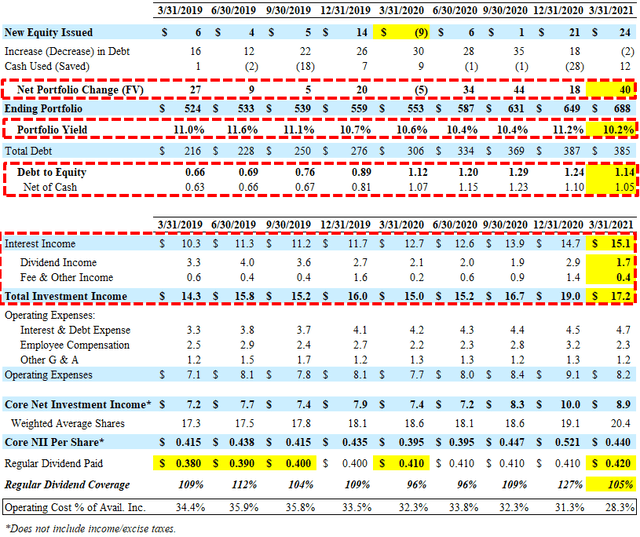
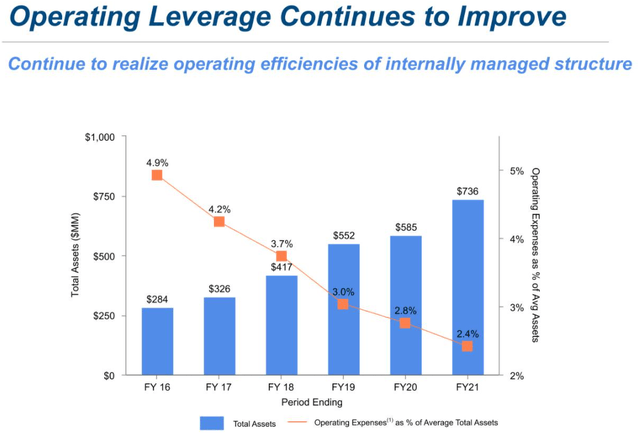
For calendar Q1 2021, CSWC beat its base case projections due to higher-than-expected portfolio growth and lower employee expenses partially offset by lower dividend income from its I-45 Senior Loan Fund as well as lower fee and other income. However, total interest income continues to increase to highest level (over $15 million as predicted) which should improve dividend coverage as the company leverages its internal operating cost structure driving continued dividend increases.
“For the quarter ended March 31, 2021, Capital Southwest reported total investment income of $17.2 million, compared to $19.0 million in the prior quarter. The decrease in total investment income was primarily attributable to prepayment fees and a one-time dividend received in the prior quarter, partially offset by an increase in average debt investments outstanding.”
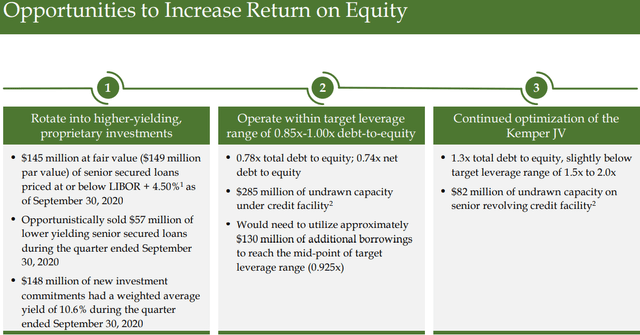
The company remains below its upper targeted leverage (1.20) with a debt-to-equity ratio (net of available cash) of 1.05. On April 20, 2021, the company received approval to form a new SBIC subsidiary with access to an additional $175 million of low-cost capital excluded from certain BDC lending ratios.
My primary concern is the recent increase in non-cash payment-in-kind (“PIK”) income during the quarter from $1.6 million to $2.8 million which could include some one-time items. The company has not released the updated 10-K filing with necessary details and this may be discussed on the upcoming earnings call. I will include a full update in the CSWC Projections & Pricing report.
As of March 31, 2021, CSWC had almost $32 million in unrestricted cash and almost $217 million in available borrowings under its credit facility for upcoming portfolio growth. Previously, management was targeting a debt-to-equity ratio between 1.00 and 1.20 but will likely use higher amounts of leverage over the coming quarters due to improved portfolio mix (safer investments) and access to SBA leverage:
“From an economic leverage perspective, we really have targeted between 1.20 and 1.30, even getting the SBA money when that does happen, we don’t plan on levering up economic leverage beyond there. We probably will show up with 1.00 to 1.15 on regulatory leverage and stick to 1.20 to 1.30 on our total economic leverage.”
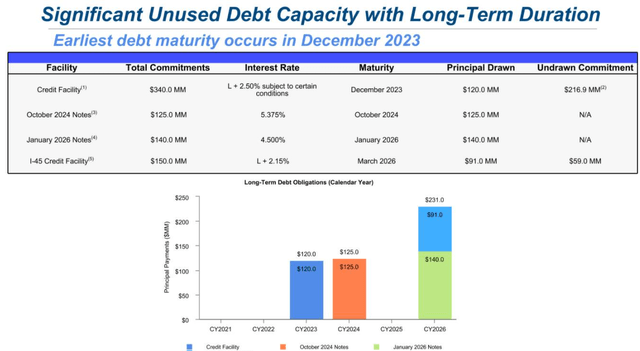
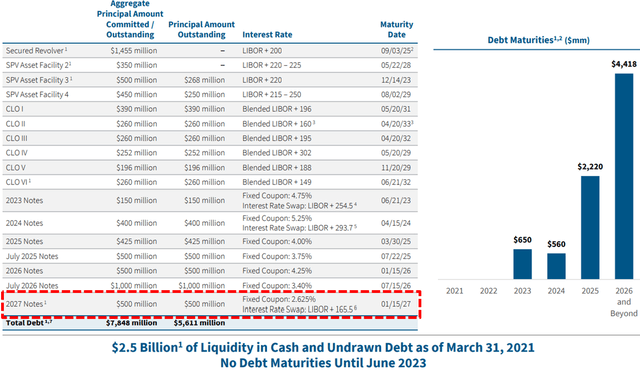
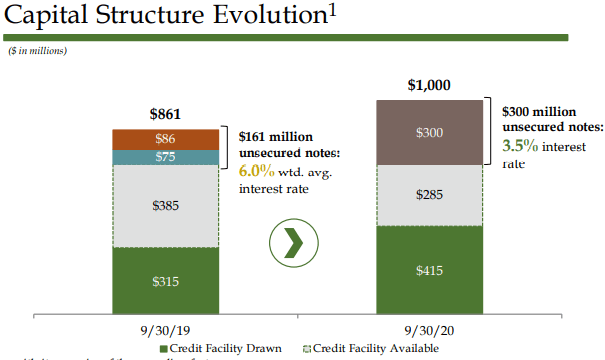
Dividend coverage will likely improve due to reduced borrowing expenses including the recent issuance of $65 million of notes at 4.00% and the redemption of its 5.95% Baby Bond “CSWCL” and continued portfolio growth. As mentioned later, there was slightl negative imact to its NAV per share due to writing off the unamortized debt issuance costs during the quarter:
“On January 21, 2021, the Company redeemed the remaining $37,136,175 in aggregate principal amount of issued and outstanding December 2022 Notes. Accordingly, during the three months ended March 31, 2021, the Company recognized realized losses on the extinguishment of debt of $0.5 million, equal to the write-off of the related unamortized debt issuance costs during the quarter ended March 31, 2021.
In March 2019, CSWC established its equity “At-The-Market” (“ATM”) program of slowly issuing small amounts of shares at a premium to book value/NAV and accretive to shareholders. As CSWC’s stock price continues higher, management will likely use the ATM program for raising equity capital, rather than larger equity offerings. This approach is beneficial for many reasons including being more efficient, delivering higher net proceeds to the company, and less disruptive to market pricing.
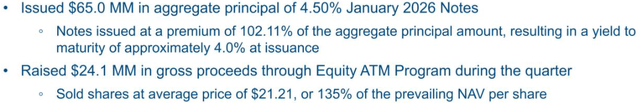
During Q1 2021, the company sold 1,137,476 shares at a weighted-average price of $21.21 per share (35% premium to previous NAV per share), raising $23.6 million of net proceeds through its “At-The-Market” (“ATM”) equity program.
In February 2021, the company issued an additional $65 million of its January 2026 Notes at a price of 102.11% resulting in a yield-to-maturity of approximately 4.0%.
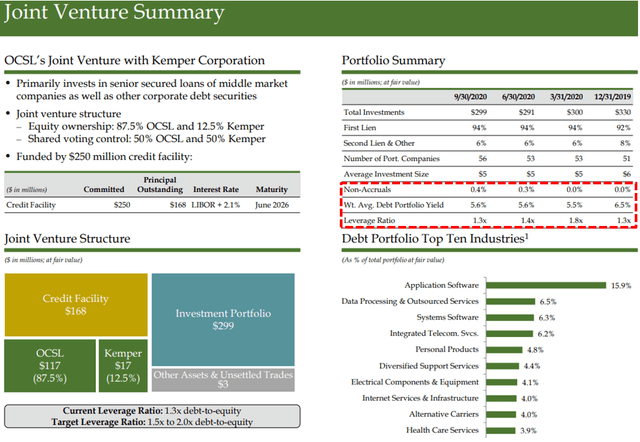
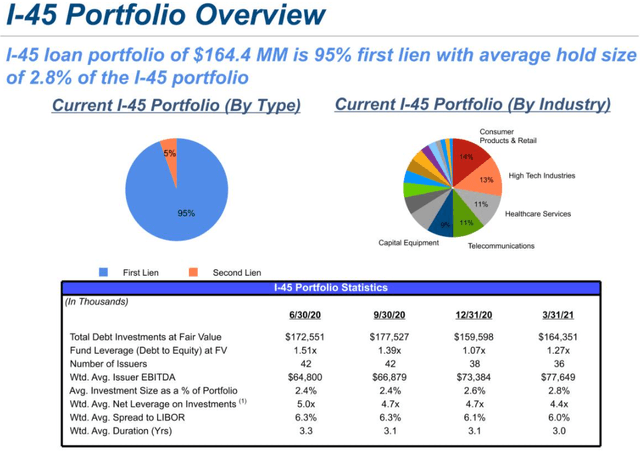
Its I-45 Senior Loan Fund accounts for around 8% (previously 10%) of the total portfolio and is a joint venture with MAIN created in September 2015. The portfolio is 95% invested in first-lien assets with CSWC receiving over 75% of the profits providing 10.2% annualized yield (previously 10.6%) paying a quarterly dividend of $1.5 million (previously $1.7 million).
CSWC Quick Risk Profile Update
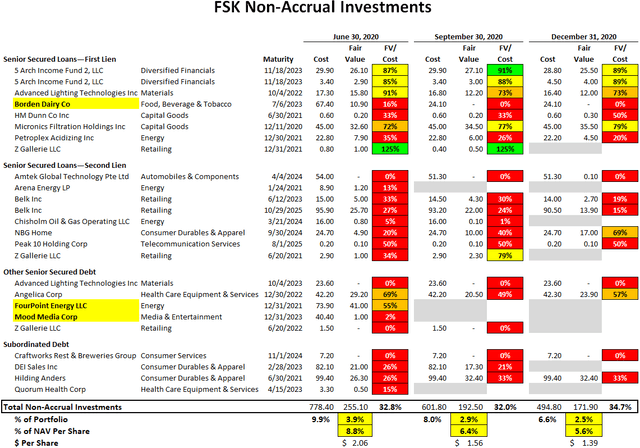
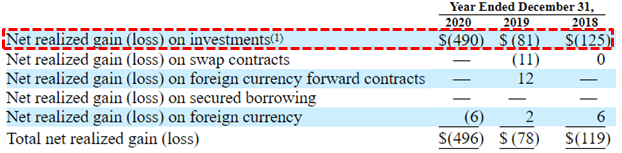
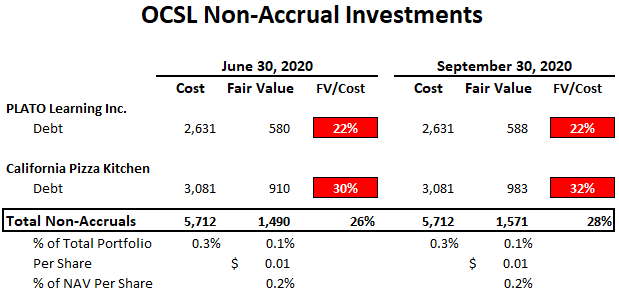
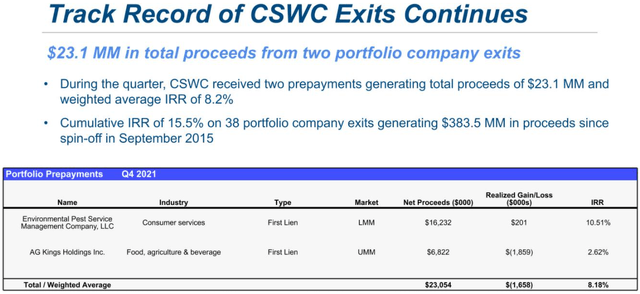
There was an improvement in overall credit quality mostly due to exiting its only non-accrual investment in AG Kings Holdings that was purchased by Albertsons as discussed in previous reports driving a slight realized loss for the quarter:
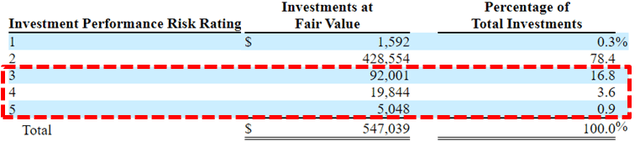
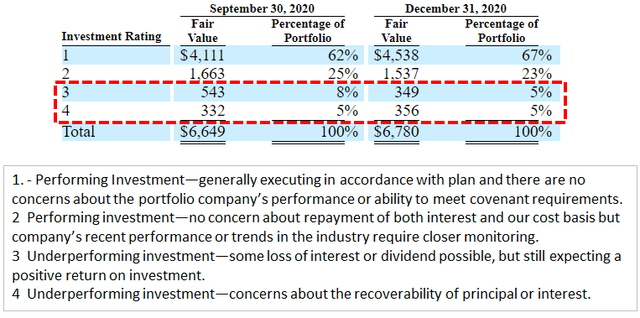
Similar to other BDCs, my primary concern is the 9.2% (previously 12.5% in calendar Q1 2020) of the portfolio considered ‘Investment Rating 3’ which implies that the “investment may be out of compliance with financial covenants and interest payments may be impaired, however, principal payments are generally not past due.”
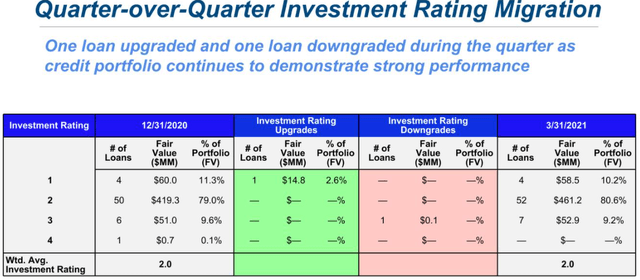
Investment Rating 3 involves an investment performing below underwriting expectations and the trends and risk factors are generally neutral to negative. The portfolio company or investment may be out of compliance with financial covenants and interest payments may be impaired, however principal payments are generally not past due.
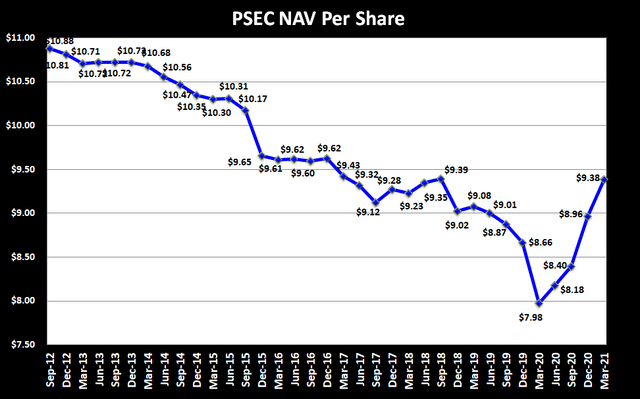
For calendar Q1 2021, CSWC’s NAV per share increased by $0.27 or 1.7% (from $15.74 to $16.01) mostly due to the previously discussed shares issued at a 35% premium to NAV adding around $0.27 per share. The company overearned the regular dividend and there was portfolio appreciation but mostly offset by the supplemental dividend of $0.10 per share and the early redemption of CSWCL. Again, CSWC has not released its updated 10-K SEC filing with details to properly assess changes to NAV.
Full BDC Reports
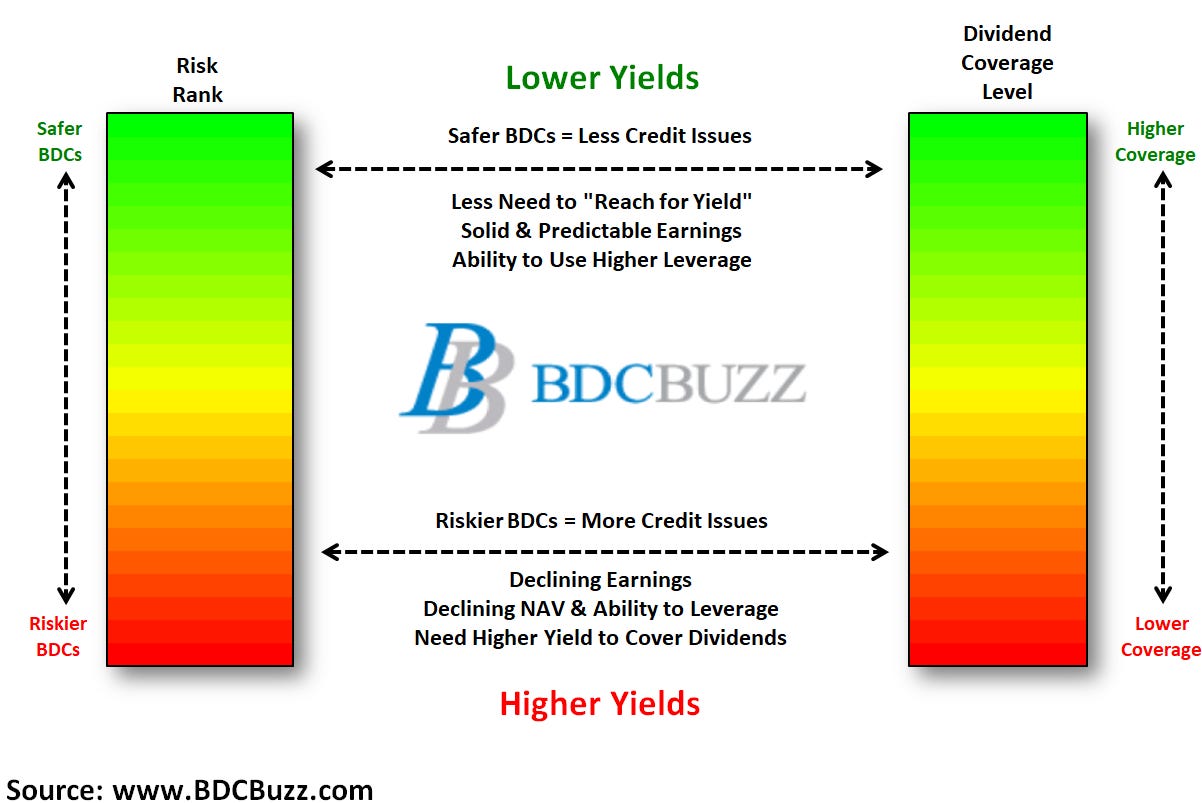
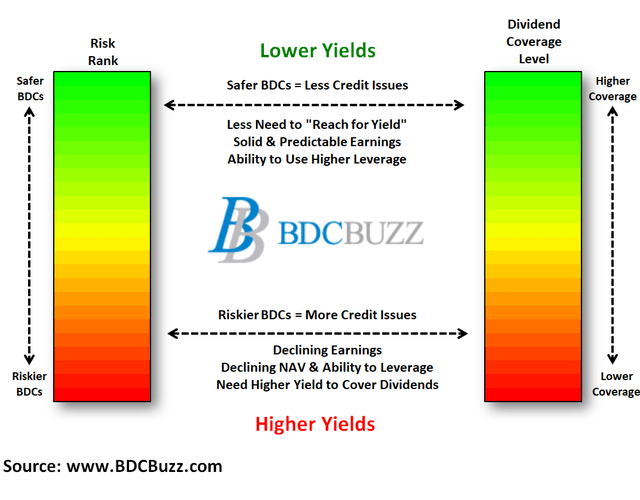
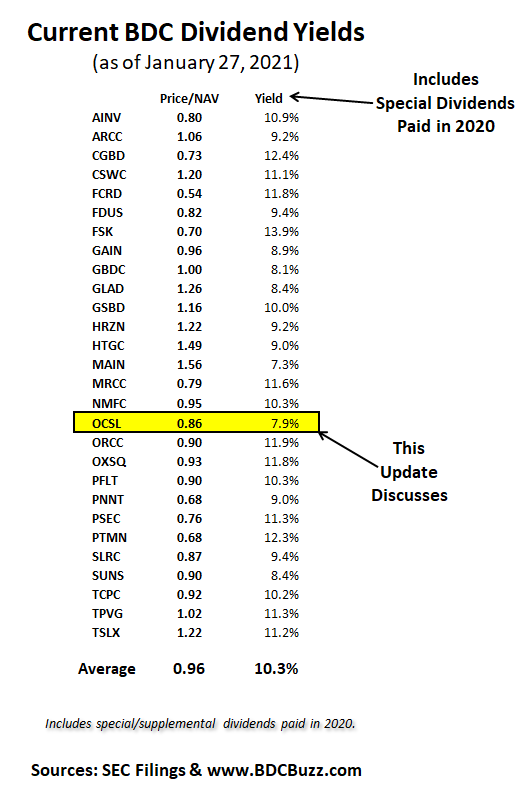
This information was previously made available to subscribers of Premium BDC Reports. BDCs trade within a wide range of multiples driving higher and lower yields mostly related to portfolio credit quality and dividend coverage potential (not necessarily historical coverage). This means investors need to do their due diligence before buying.