MAIN Dividend Coverage Update
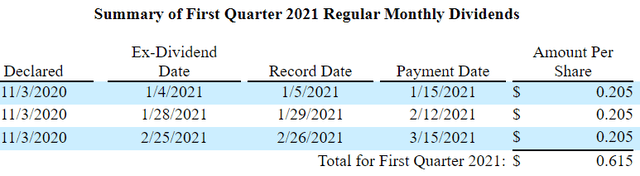
On November 4, 2020, Main Street Capital (MAIN) reaffirmed its regular monthly dividend of $0.205 per share:
“Despite the negative impact of these items and the resulting level of DNII in the quarter as a result of our diversified investment portfolio, together with the advantages of our differentiated investment strategy, the increasing benefits from our asset management business, our strong investment pipeline, our efficient operating structure and alignment of interest with our shareholders, combined with our conservative capital structure and strong liquidity position, we remain comfortable with our commitment to maintaining a stable monthly dividend payment level going forward. To that end, earlier this week, our Board declared our first quarter 2021 regular monthly dividends of $0.205 per share payable in each of January, February and March, an amount that is unchanged from our monthly dividends for the fourth quarter.”
The company will likely not cover its dividend over the coming quarters partially due to lower dividend income from equity investments. However, management is expecting higher amounts over the next few quarters:
“These results reflect the continued negative impact of the pandemic on the overall economy, most specifically in the significant decrease in the amount of dividend income we realized from our equity investments and an increase in the number of investments on non-accrual status at quarter end. We remain confident that the decrease in dividend income is a temporary issue, partly due to the conservative approaches many of our portfolio companies are taking in managing their capital and liquidity in response to the pandemic. And we believe this dividend income will recover as the impacts of the pandemic subside.”
“Part of the reason we expect the dividend income to start recovering is that as we touched on our prior comments that the view that our management teams across the portfolio have about their current business conditions is significantly better today than it was couple of quarters ago. So they continue to get more comfortable, they will be more comfortable in paying out dividends as opposed to retain that as liquidity for their business. We don’t expect them to take all that liquidity that they have built over the last couple of months and pay it out in the fourth quarter, we think that they will continue to be gradual in their approach to utilizing their liquidity. So we don’t expect that it will be a one-time event, we think it will be something that will play out over the next three to four quarters as our results continue to improve and the economy overall heals and they continue to be more and more comfortable releasing some of that liquidity that they have retained over the last 6 months.”
I am expecting dividend coverage to improve over the coming quarters due to:
- Increased dividend income from portfolio companies.
- Effective October 31, 2020, MAIN became the sole adviser/manager to HMS and the company will now receive 100% of all management and incentive fees.
- Lower non-accruals (increased interest income from restructured investments).
- Portfolio growth (increased interest income).
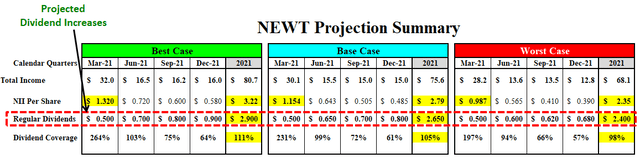
All of this was recently discussed on the earnings call with management and is taken into account with the updated base and best-case projections that I will be watching closely:
Q. “I am wondering if you could just further expand upon your comments in terms of the key drivers for improving foreseeing potential improving distributable net investment income over the near-term, just curious as to potentially what kind of assumptions are being built in?”
A. “So there is a couple of drivers there. One, obviously, is the transaction that we completed through which we became the sole advisor to HMS. So we have not had that prior to 9/30 really that relationship as we announced in our press release last week starts on October 30. So, that will be a driver both in Q4, with incremental income versus Q3, but also additional benefit in Q1 as we have that benefit for the full quarter as opposed to 2 months. So, that’s one of the drivers. I think, David touched on his comments and we have given him some of our responses here to the questions, dividend income from our lower middle-market companies will be another big driver. We do expect that, that benefit or that improvement to be gradual over multiple quarters, but we are seeing improvement there. So, we expect to see that number continue to increase both in Q4 and Q1 and going forward as we continue to move forward from where we have been over the last couple of quarters. The last big driver is just the new investment activity. As we touched on, we are seeing robust activity and very attractive opportunities both in our lower middle-market business and private loans. So as we see those new investments come on in Q4 and then Q1 as well, that incremental investment income that comes from those investments will also be a key driver of that improvement.”
“Based upon the positive developments we have seen in our existing portfolio companies, coupled with the future benefits of the growth in our asset management business and the attractive new investment opportunities we are seeing in our lower middle-market and private loan strategies, we are confident that the third quarter represented the low point for our distributable net investment income, or DNII and we expect to see increases in our DNII in the fourth quarter and future quarters.”
“As we look forward to the fourth quarter, we expect that we will generate distributable net investment income of $0.53 to $0.56 per share as our results begin to recover from the impacts of the pandemic and set us on a pace and expectation to cover our monthly dividend rate with distributable net investment income over the next few quarters.”
Effective October 31, 2020, MAIN became the sole investment adviser and administrator to HMS Income Fund (“HMS”), and HMS Income changed its name to MSC Income Fund, Inc. The new advisory agreement includes a 1.75% management fee (reduced from 2.00%) and the same incentive fee calculations as under the prior advisory agreement, with the External Investment Manager receiving 100% of such fee income (increased from 50% previously).
“We are also very pleased with our recent announcement of the completion of the transaction under which we became the sole investment adviser to HMS Income Fund, which is now known as MSC Income Fund. We are excited about positioning the fund for the future, while also continuing to execute our overall strategy to grow our asset management business within our internally managed BDC structure and continuing to provide this unique benefit to our Main Street stakeholders.”
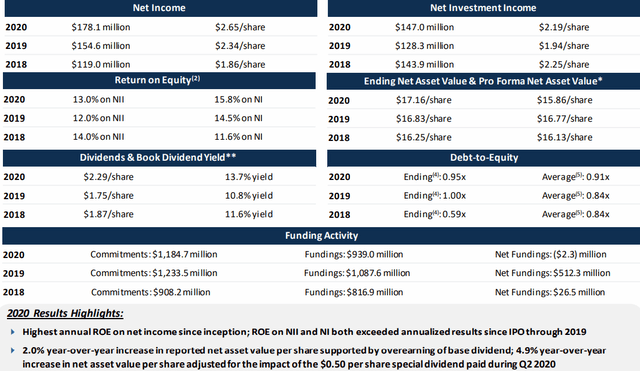
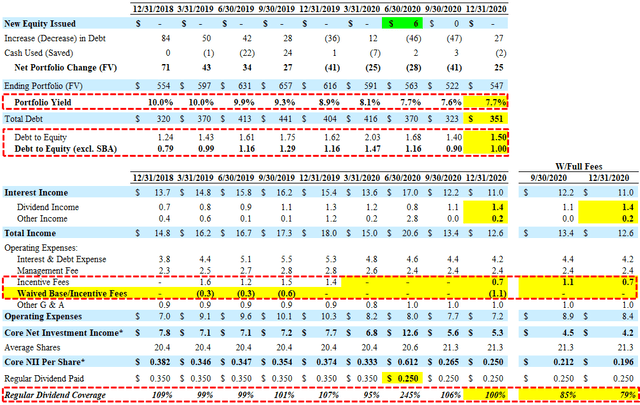
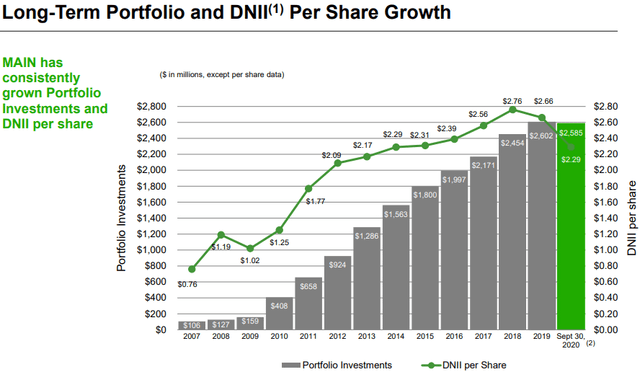
Over the last 12 months, its DNII per share has fallen by 24% mostly due to declining rates and portfolio yield, and lower dividend income. DNII was only $0.50 per share for Q3 2020 compared to dividends paid of $0.615.
If MAIN reports closer to its ‘worst-case’ Q4 2020 projections, the company will be downgraded as there is a chance that its conservative management will follow suit with GBDC and proactively reduce its monthly dividend (to over earn the dividend).
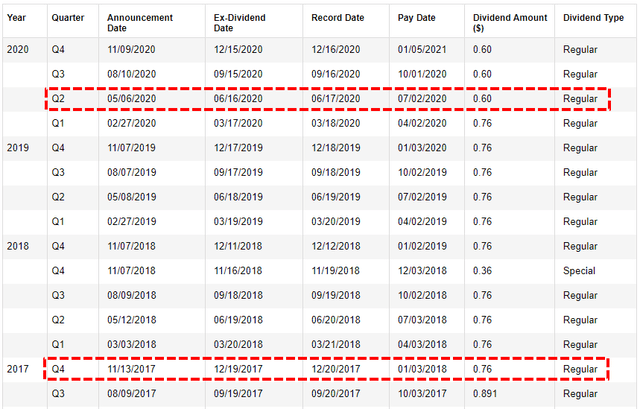
Previously, the semi-annual/supplemental dividends were covered through overearning the regular dividend and realized capital gains. However, as predicted in previous reports, the company suspended its semi-annual/supplemental dividend until dividend coverage improves. Historically, MAIN had better-than-average dividend coverage due to its many advantages over other BDCs, including the lower cost of capital and the lowest operational cost structure. Also, MAIN has an excellent history of portfolio credit quality that delivers a consistent stream of recurring interest income, the potential for increased earnings through its asset management business, the ability to use higher leverage through its SBIC licenses and management with conservative dividend policy.
“Since its October 2007 initial public offering, Main Street has periodically increased the amount of its regular monthly dividends paid per share and has never reduced its regular monthly dividend amount per share. Including all dividends declared to date, Main Street will have paid $30.22 per share in cumulative cash dividends since its October 2007 initial public offering at $15.00 per share.”
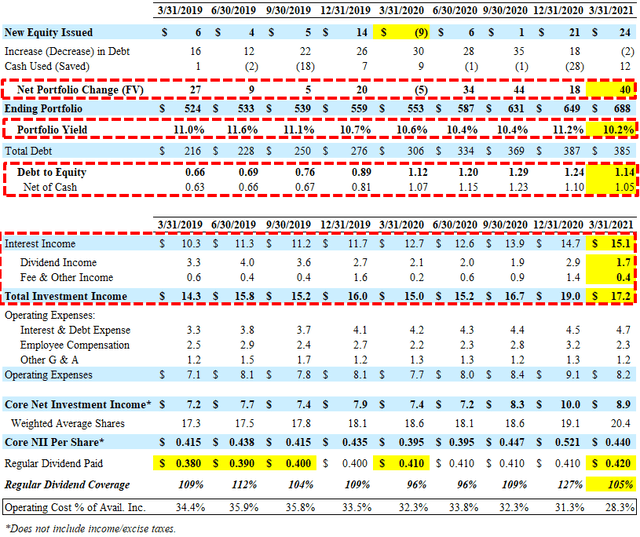
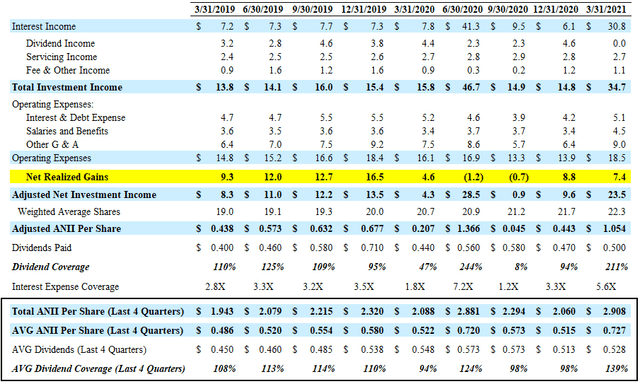
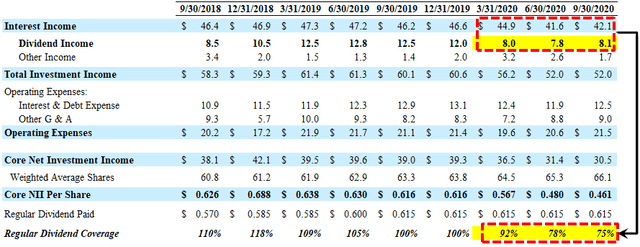
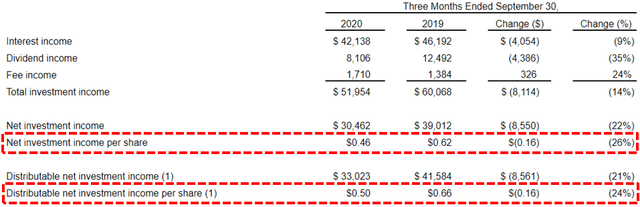
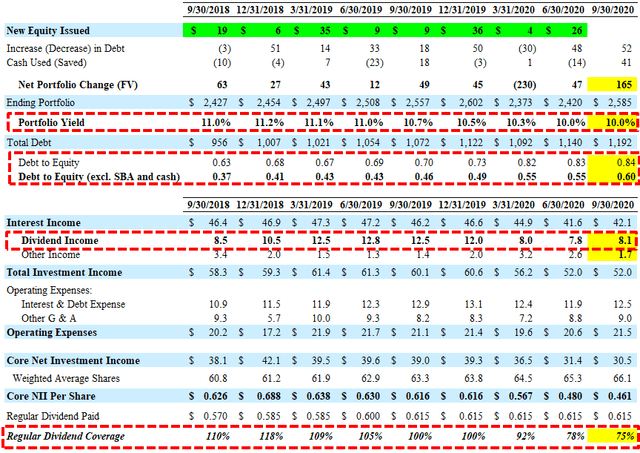
For Q3 2020, MAIN hit its base case projections with NII per share of $0.46. As mentioned earlier, distributable net investment income (“DNII”) was only $0.50 per share compared to its regular dividends of $0.615 implying 81% coverage (with DNII). The lower dividend coverage is due to lower interest rates (LIBOR) driving a lower portfolio yield as well as a meaningful decrease in dividend income from equity investments:
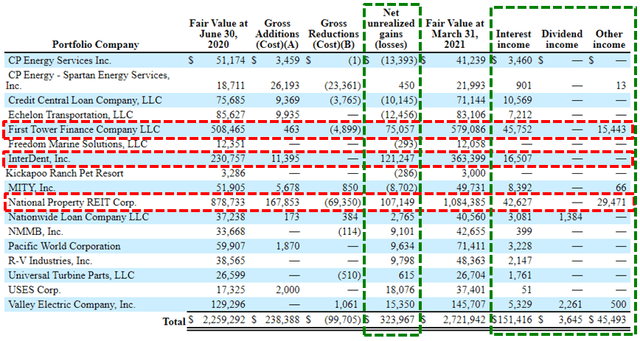
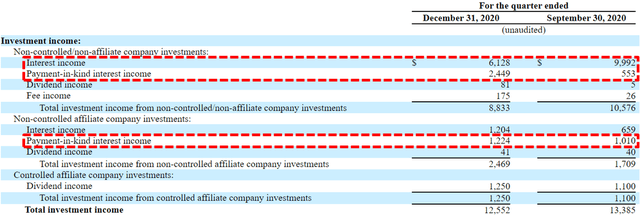
“Our total investment income in the third quarter decreased over the same period in 2018 to a total of $52 million primarily driven by a decrease in the dividend income due to the negative impacts from the COVID pandemic and a decrease in interest income, primarily due to lower LIBOR rates. The change in total investment income also includes a decrease of $1.3 million related to lower levels of accelerated income for certain debt investments when compared to the third quarter of last year.”
“The $8.1 million decrease in total investment income in the third quarter of 2020 from the comparable period of the prior year was principally attributable to a $4.4 million decrease in dividend income from investment portfolio equity investments, primarily resulting from the negative impacts of the COVID-19 pandemic on certain of our portfolio companies’ operating results, financial condition and liquidity and a $4.1 million decrease in interest income, which was primarily due to lower floating interest rates on investment portfolio debt investments, based upon the decline in the London Interbank Offered Rate (“LIBOR”).”
MAIN Risk Profile Update
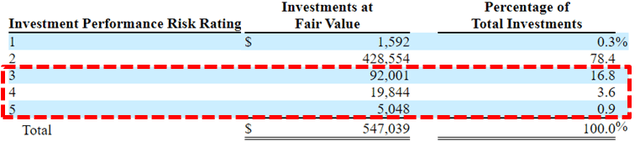
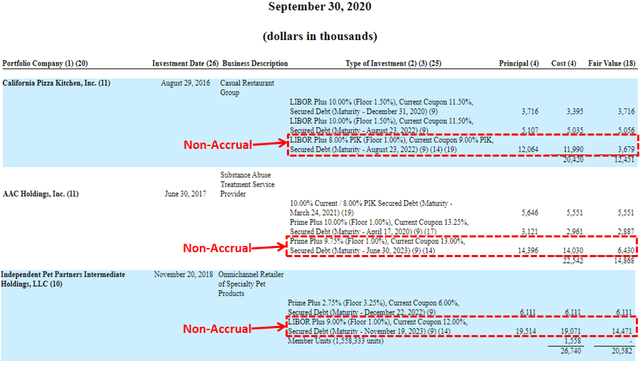
Non-accrual investments increased due to adding Independent Pet Partners, Central Security Group, and California Pizza Kitchen. Bluestem Brands and VIP Cinema were previously marked down and exited during Q3 2020. As of September 30, 2020, there were 12 investments on non-accrual status (previously 11 investments) that increased to 2.6% of the total investment portfolio at fair value (previously 1.8%) and 7.1% at cost (previously 6.3%). However, management (as well as myself) is expecting fewer non-accrual investments for Q4 2020 some of which will be restructured and put back on accrual status. MAIN has 193 portfolio companies so a certain amount on non-accrual is to be expected.
“Our current expectation is that we will reduce the number of investments on non-accrual status by 3 to 4 investments during the fourth quarter as we continue to proactively work through these non-accrual investments with management teams and financial sponsors of these companies. We do expect to have, a number of those non-accruals that we work through and would expect to see that number of decrease as we move into the fourth quarter. The negative impact of COVID-19 began to lessen and visibility improved for our portfolio of companies. As a result, we saw the general environment for our existing portfolio companies stabilized as compared to earlier this year.”
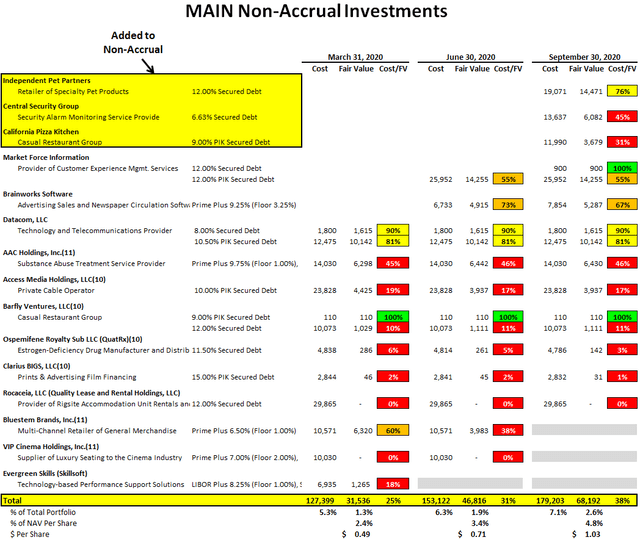
Datacom, LLC a provider of communication and data transfer technology solutions to the oil & gas exploration and production and marine industries, was added to non-accrual status during Q2 2018 and needs to be watched as the debt portions are still marked over 80% of cost. But there is a good chance that this will be one of the companies placed back on accrual status.
It is important to note that MAIN has additional investments in some of its non-accrual portfolio companies that are still on accrual and need to be watched including California Pizza Kitchen, AAC Holdings, and Independent Pet Partners:
Similar to Capital Southwest (CSWC), MAIN added American Addiction Centers or AAC Holdings, Inc. (AAC) to non-accrual status during Q3 2019 and has been discussed in previous reports. In June 2020, AAC filed for bankruptcy and its lenders agreed to provide the company with $62.5 million of incremental financing aimed at reducing the company’s debt and providing financial stability for long-term growth.
Its non-accrual oil/energy investments in Rocaceia, LLC (Quality Lease and Rental Holdings) previously filed for bankruptcy but has already been written off with no further impact to NAV. During Q1 2018, Access Media Holdings, a private cable operator, was placed on non-accrual status with the equity portion written off, and the debt is marked at 17% of cost which was previously converted to “payment-in-kind” (“PIK”) income and the accrued portions were deducted from Q1 2018.
American Teleconferencing Services, Ltd. (“ATS”) is an investment also held by CSWC, PFLT and SUNS that operates as a subsidiary of Premiere Global Services (“PGi”), offering conference call and group communication services. This investment remains on accrual status marked at 70% of cost (likely has improved over the recent quarter) and previously rated by Moodys as Caa2: “characterized by fundamental challenges from the high rates of decline in its legacy audio conferencing business as a result of competition from cloud-based communications and collaboration offerings.”
Full BDC Reports
This information was previously made available to subscribers of Premium BDC Reports, along with:
- MAIN target prices and buying points
- MAIN risk profile, potential credit issues, and overall rankings
- MAIN dividend coverage projections and worst-case scenarios
- Real-time changes to my personal portfolio
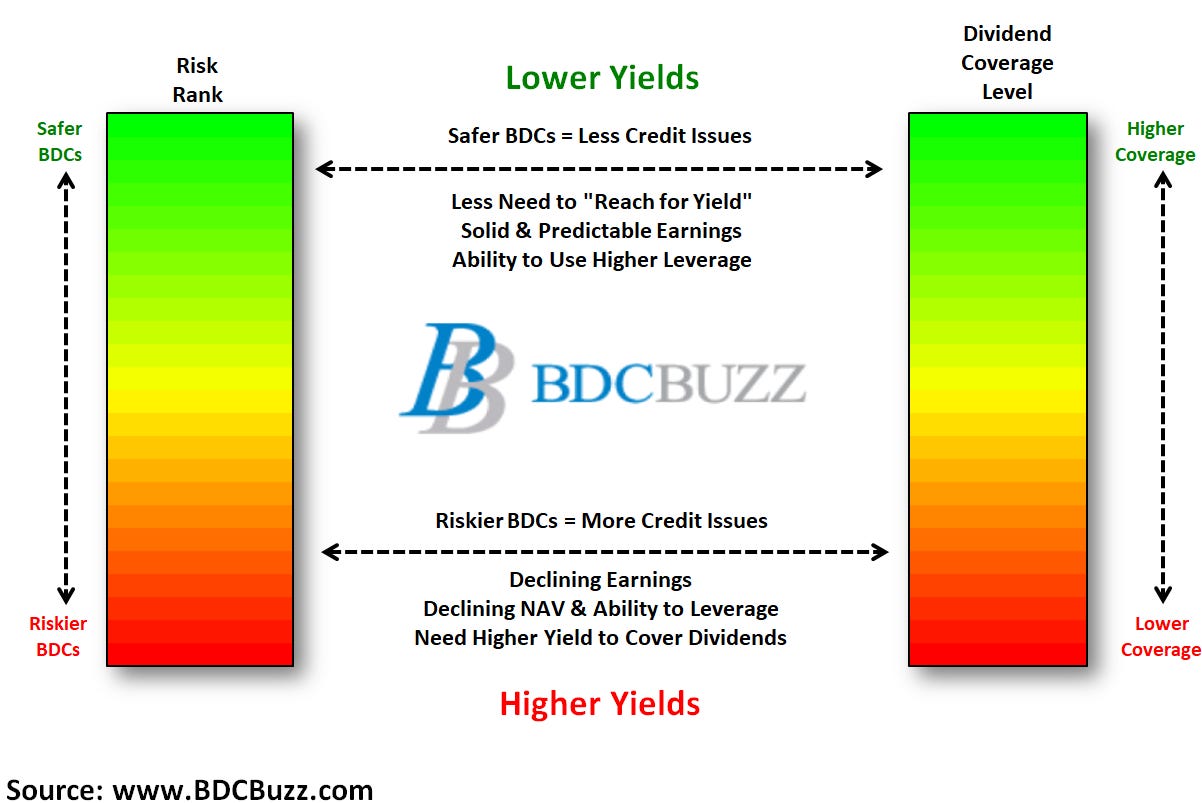
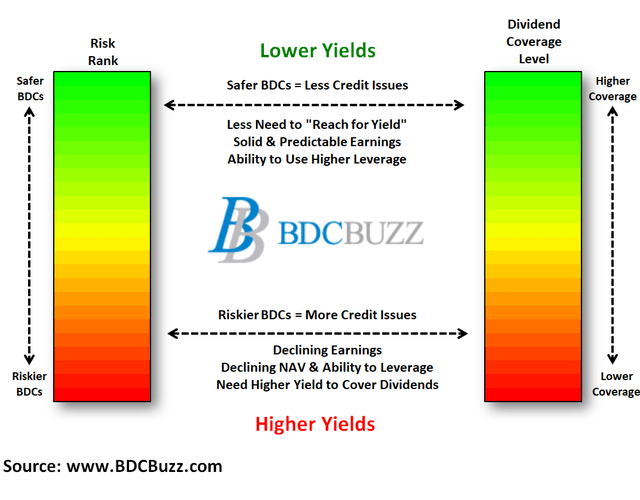
BDCs trade within a wide range of multiples driving higher and lower yields mostly related to portfolio credit quality and dividend coverage potential (not necessarily historical coverage). This means investors need to do their due diligence before buying.
To be a successful BDC investor:
- Identify BDCs that fit your risk profile.
- Establish appropriate price targets based on relative risk and returns (mostly from regular and potential special dividends).
- As companies report results, closely monitor dividend coverage potential and portfolio credit quality.
- Diversify your BDC portfolio with at least five companies. There are around 45 publicly traded BDCs; please be selective.