NMFC Preliminary Q2 2020 Results: Upcoming Public Article

The following information is from the NMFC Projections Update that was previously provided to subscribers of Premium BDC Reports along with target prices, dividend coverage and risk profile rankings, earnings/dividend projections, quality of management, fee agreements, and my personal positions for all Business Development Companies (“BDCs”).


Quick Update:

As mentioned in “8% To 10% Balanced Portfolio Yield Investing In America: Part 2” on Seeking Alpha, I will be using this blog for additional updates on individual BDCs.


Upcoming Public Article:

New Mountain Finance (NMFC) has recently released preliminary estimates for the quarter ended June 30, 2020, but has not been announced through the website or other news sources. I will have a public article during the week of June 28, 2020, discussing the information included in this update. NMFC’s dividend yield is currently 13.4% and remains above the average due to trading almost 20% below its book value that will likely be increasing as discussed below.

The information and presentation discussed in this update are from the SEC 8-K filing:

Link to NMFC press releases:

The most recent is from May 6, 2020, reporting March 31, 2020, results:

NMFC 1


As there was no formal announcement, most news sources did not pick it up including SA as shown below:

NMFC 2


NMFC Preliminary June 30, 2020 Update:

I recently updated the projections and pricing for NMFC to take into account the preliminary estimates provided by the company including:

  • Leverage decreasing from 1.56x to 1.35x as of June 30, 2020 = stronger balance sheet.
  • Increased NAV per share including a likely 2% increase in portfolio values which would drive leverage lower.
  • No material migration on Risk Ratings = stable credit quality.
  • No new non-accruals other than the one that was already discussed.
  • Q2 2020 earnings expected to be $0.30 per share covering the dividend.


NMFC 5

Analyst Earnings Expectations:

It should be noted that analysts are currently expecting earnings of just under $0.29 per share:

NMFC 6

Deleveraging and Cash Flow:

As shown below, the company had around $255 million of sales and repayments as compared to only $34 million of new investments as well as over-earning the dividend from cash sources. These allowed the company to reduce its borrowings/debt by $232 million.

NMFC 3

NMFC 7

NMFC 8


Previously Expected Dividend Reduction:

In previous reports, I discussed the expected dividend reduction which was announced early last month as the company is working to improve liquidity and cash flow:

NMFC 9


NMFC’s dividend yield remains above the average BDC:


NMFC 14


NMFC Risk Profile:

This where I spend most of my research efforts.

Public articles including “Building A Retirement Portfolio With 6% To 9% Yield: Part 4” have discussed NMFC’s previous “watch list” investments including Edmentum Ultimate Holdings, NHME Holdings, Permian Holdco, Ansira Holdings, AAC Holding, PPVA Black Elk, ADG LLC, York Risk Services and Sierra Hamilton.

However, given the various impacts from COVID-19, this list has obviously grown to include (among others) dental-related companies such as Affinity Dental, ADG, Affordable Care Holding, Benevis Holding, DCA Investment, Dentalcorp Health Services, Heartland Dental, and NM YI. There are plenty of other companies including CentralSquare Technologies that need to be watched and management provided the following detail in May 2020:


NMFC 13

NMFC 11

NMFC 12


It should be noted that some of the recent exits were below cost and will result in realized losses of around $0.05 per share. However, many of these exits were above the March 31, 2020, valuations which means that there will be an improvement to NMFC’s net asset value (“NAV”) per share related to these as well as the recent recovery of syndicated loans values as shown in an earlier slide above.


NMFC 4


Full BDC Reports:

This information was previously made available to subscribers of Premium BDC Reports, along with:

  • NMFC target prices and buying points
  • NMFC risk profile, potential credit issues, and overall rankings
  • NMFC dividend coverage projections and worst-case scenarios
  • Real-time changes to my personal portfolio

To be a successful BDC investor:

  • Identify BDCs that fit your risk profile.
  • Establish appropriate price targets based on relative risk and returns (mostly from regular and potential special dividends).
  • As companies report results, closely monitor dividend coverage potential and portfolio credit quality.
  • Diversify your BDC portfolio with at least five companies. There are around 50 publicly traded BDCs; please be selective.

GBDC Update: Dividend Coverage & Risk Profile

The following is from the GBDC Update that was previously provided to subscribers of Premium BDC Reports along with revised target prices, dividend coverage and risk profile rankings, potential credit issues, earnings/dividend projections, quality of management, fee agreements, and my personal positions for all business development companies (“BDCs”).


gbdc yield.png

GBDC Update Summary:

  • For the quarter ended December 31, 2019, GBDC hit its base case projections mostly due to its fee structure as discussed in previous reports.
  • As predicted, Oliver Street Dermatology was added to non-accrual status along with MMan Acquisition Co. that were previously considered ‘watch list’ investments.
  • However, portfolio credit quality remains strong with low non-accrual investments as a percentage of total investments at 1.2% fair value. GBDC has 250 portfolio companies, so a certain amount on non-accrual status is to be expected.
  • NAV per share decreased by $0.10 or 0.6% (from $16.76 to $16.66) mostly due to paying a special distribution of $0.13 per share.
  • Also predicted and discussed in the previous report, GBDC has decided to dissolve its SLF and finance the assets directly on its balance sheet (driving higher leverage) and will be taken into account with the updated projections.

For the quarter ended December 31, 2019, Golub Capital BDC (GBDC) hit its base case projections covering its dividend by 102%. As predicted, Oliver Street Dermatology was added to non-accrual status but total non-accruals remain low as discussed next.


Portfolio credit quality remains strong with low non-accrual investments as a percentage of total investments at 1.2% and 1.5% of fair value and cost, respectively. As discussed in previous updates, U.S. Dermatology Partners has defaulted on a $377 million financing provided by a group of investment firms, according to people with knowledge of the matter. The dermatology practice owner is now reviewing its options, including a recapitalization or debt-for-equity swap with its current lenders, Golub Capital, The Carlyle Group Inc. and Ares Management, according to the people, who asked not to be identified because they aren’t authorized to speak about it. During the previous earnings call, GBDC management was asked about its related investment in Oliver Street Dermatology:

Q. “I saw the — a change to the mark and addition of a PIK component to Oliver Street Dermatology. So wanted to ask what’s going on there?”

A. “I’m going defer discussing a specific situation like Oliver Street. I don’t think it is an appropriate topic for this call.”

During the most recent call, GBDC management discussed additional non-accruals (including Oliver Street Dermatology) mentioning that they are “cautiously optimistic that in respect of both companies, we are on a good path toward good recoveries”:

“So non-accruals at cost and fair value increased in the most recent quarter to 1.6% and 1.3%, respectively. Whenever we think about non-accruals, we feel a degree of concern, right. We are naturally worriers. We worry about everything. One of the things we worry about is non-accruals. I want to make sure, though, that everyone keeps our concerns in appropriate context. So first, this quarter GBDC continued its strong track record of generating positive net realized and unrealized gains on investments. And that’s the metric that we think is, over time, the most important indicator of credit performance. That’s why we focus so much in our earnings presentation each quarter on the chart in our presentation depicting NAV per share over time. A second way we look at credit and overall credit quality is based on risk ratings, I think they show a great deal of stability quarter-over-quarter and for many quarters in a row. And the third contextual point I will make is that the latest figures indicate that even with this small increase, we are still in the low end of the range of the industry and we are in our historical range in respect of non-accruals at cost. So I don’t want to make any of this sound like it’s more dramatic than it is. With that said, we are working hard with the managements of the two companies that we put on non-accrual this quarter and I can’t get into the details of either of the two situations, but what I can say is, I am cautiously optimistic that in respect of both companies, we are on a good path toward good recoveries.

Oliver Street Dermatology and MMan Acquisition Co. were previously considered ‘watch list’ investments (please see GBDC Deep Dive report for discussions) and were added to non-accrual status during the recent quarter. The Sloan Company, Advanced Pain Management, and Paradigm DKD Group were added to non-accrual status during the previous quarter and the two other investments that remain on non-accrual are Aris Teleradiology Company and Uinta Brewing Company.


It is important to remember that GBDC has 250 portfolio companies, so a certain amount on non-accrual status is to be expected.


As mentioned in the previous report, there was a meaningful increase in GBDC’s net asset value (“NAV”) per share during the previous quarter mostly due to the accretive acquisition of Golub Capital Investment Corporation (“GCIC”). During the three months ended December 31, 2019, NAV per share decreased by $0.10 or 0.6% (from $16.76 to $16.66) mostly due to paying a special distribution of $0.13 per share.


GBDC has predictably boring quarterly NII of $0.33/ $0.32 mostly due to its fee structure combined with strong portfolio credit quality. The financial projections use a wide range of assumptions but because of the incentive fee hurdle, the dividend is consistently covered by design. This calculation is based on “net assets” per share which will increase due to the merger driving a higher amount of “pre-incentive fee net investment income” per share before management earns its income incentive fees.


The annualized quarterly return from its Senior Loan Fund LLC (“SLF”) and GCIC SLF were 2.4% and 10.1%, respectively, for the quarter ended December 31, 2019. However, as predicted and discussed in the previous report, GBDC has decided to dissolve its SLF and finance the assets directly on its balance sheet (driving higher leverage) and will be taken into account with the updated projections:

“On January 1, 2020, the Company entered into a purchase agreement with RGA, Aurora, SLF, and GCIC SLF (the “Purchase Agreement”). Pursuant to the Purchase Agreement, RGA and Aurora (together the “Transferors”) agreed to sell their LLC equity interests in SLF and GCIC SLF, respectively, to the Company, effective as of January 1, 2020. As consideration for the purchase of the LLC equity interests, on or before March 2, 2020, the Company has agreed to pay the Transferors an amount, in cash, equal to the net asset value of their respective LLC equity interests as of December 31, 2019 (the “Net Asset Value”) along with interest on such Net Asset Value accrued from the date of the Purchase Agreement through, but excluding, the payment date at a rate equal to the short-term applicable federal rate. As a result of the Purchase Agreement, on January 1, 2020, SLF and GCIC SLF became wholly-owned subsidiaries of the Company. In addition, the capital commitments of the Transferors to the SLFs were terminated. As wholly-owned subsidiaries, the assets, liabilities, profit and losses of the SLFs will be consolidated into the Company’s financial statements and notes thereto for periods ending on or after January 1, 2020, and will also be included for purposes of determining the Company’s asset coverage ratio.”


There was another decline in overall portfolio yield from 8.4% to 8.0% due to new investments at lower yields of 7.4% as shown in the following table.


New investment commitments totaled $271 million and were primarily one-stop loans at lower yields similar to the previous quarter:


GBDC’s liquidity and capital resources are primarily debt securitizations (also known as collateralized loan obligations, or CLOs), SBA debentures, and revolving credit facilities.

On October 28, 2019, the company increased the borrowing capacity from $40 million to $100 million on its GC Adviser Revolver On October 11, 2019, the company entered into an amendment to the documents governing its credit facility with Morgan Stanley Bank, which increased the borrowing capacity from $300 million to $500 million.


This information was previously made available to subscribers of Premium BDC Reports, along with:

  • GBDC target prices and buying points
  • GBDC risk profile, potential credit issues, and overall rankings
  • GBDC dividend coverage projections and worst-case scenarios
  • Real-time changes to my personal portfolio

To be a successful BDC investor:

  • As companies report results, closely monitor dividend coverage potential and portfolio credit quality.
  • Identify BDCs that fit your risk profile.
  • Establish appropriate price targets based on relative risk and returns (mostly from regular and potential special dividends).
  • Diversify your BDC portfolio with at least five companies. There are around 50 publicly traded BDCs; please be selective.

PNNT Update: Dividend Coverage & Risk Profile

The following is from the PNNT Update that was previously provided to subscribers of Premium BDC Reports along with revised target prices, dividend coverage and risk profile rankings, potential credit issues, earnings/dividend projections, quality of management, fee agreements, and my personal positions for all business development companies (“BDCs”).


pnnt yield.png

PNNT Update Summary:

  • PNNT reported just below its worst-case projections mostly due to lower-than-expected portfolio yield and “the timing of purchases and sales” only covering 87% of the dividend but should improve next quarter.
  • Portfolio growth was much higher-than-expected with almost $174 million of new investments during the quarter but likely weighted toward the end of the quarter.
  • Its debt-to-equity is around 1.40 after taking into account almost $63 million “payable for investments purchased” and around 1.16 excluding SBA debentures.
  • There was another decline in the overall portfolio yield but management is improving earnings through portfolio growth, rotation out of non-income producing assets and increased leverage available with its “green light” letter for its third SBIC license.
  • NAV per share increased by $0.11 or 1.3% (from $8.68 to $8.79) mostly due to marking up some of its equity positions including AKW Holdings and RAM Energy. Also, there was a meaningful markup of its first-lien position in AKW.
  • There are still no investments on non-accrual status and energy, oil & gas exposure decreased from 12.2% to 11.3% of the portfolio due to the increase in the overall size of the portfolio and marking down its investment in ETX Energy by almost $3.4 million partially offset by the markups in RAM Energy.
  • Also, PNNT finally exited its publicly traded shares U.S. Well Services (USWS) driving most of the $12 million of realized losses for the quarter.
  • One of my concerns is the recent markup of PNNT’s equity position in RAM Energy that continues to operate at a loss according to the SEC filings

PennantPark Investment (PNNT) reported just below its worst-case projections mostly due to lower-than-expected portfolio yield and “the timing of purchases and sales”. Portfolio growth was much higher-than-expected with almost $174 million of new investments during the quarter but likely weighted toward the end of the quarter. This means that the company did not receive the full benefit from interest income during the quarter. Also, it should be noted that there was almost $63 million “payable for investments purchased” which is not included in the borrowings and leverage amounts for quarter-end. The debt-to-equity ratio increased from 1.20 to 1.28 or almost 1.40 after taking into account the amounts payable.

Art Penn, Chairman and CEO: “We are pleased with the progress we are making in several areas. Our activity and selectivity have resulted in a more senior secured portfolio, which should result in even more steady and stable earnings. Additionally, our earnings stream should improve over time based on a gradual increase in our debt to equity ratio and the potential for a joint venture, a new SBIC, and the exit of successful equity investments.”

“Non-recurring net debt-related costs” and provision for taxes of $0.3 million are not included when calculating ‘Core NII’ resulting in net investment income (“NII”) per share of $0.156 which only covered 87% of the dividend but should improve next quarter.


There was another decline in its portfolio yield from 9.8% to 9.6% but management will be offsetting the impact from lower yields through the rotation out of non-income producing assets as well as increasing leverage. The company has significant borrowing capacity due to its SBA leverage at 10-year fixed rates (current average of 3.1%) that are excluded from typical BDC leverage ratios. As mentioned in the previous report, PNNT received “green light” letter for its third SBIC license for an additional $175 million of SBA financing.


Previously, PNNT was keeping a conservative leverage policy of GAAP debt-to-equity (includes SBA debentures) near 0.80 until it can rotate the portfolio into safer assets.” However, the company has already increased the amount of first-lien debt from 40% to 57% of the portfolio over the last two years and is slowly increasing its regulatory debt-to-equity (excludes SBA debentures) to 1.50:

“Over time we are targeting a regulatory debt-to-equity ratio of 1.1 to 1.5 times. We will not reach this target overnight, we will continue to carefully invest and it may take several quarters to reach the new target. A careful and prudent increase in leverage against primarily first lien assets should lead to higher earnings.”

As mentioned earlier, the company had higher-than-expected portfolio growth during the previous quarter driving its debt-to-equity to almost 1.40 after taking into account the amounts payable and around 1.16 excluding SBA debentures. On September 4, 2019, PNNT amended its SunTrust Credit Facility increasing the amount of commitments from $445 million to $475 million and amended the covenants “to enable us to utilize the flexibility and incremental leverage provided by the SBCAA.


“We are pleased that in early September we amended the credit facility enabling us to use the incremental flexibility provided by the new guidelines. Additionally, at the end of September and in early October we completed an $86 million offering of 5.5% unsecured notes. In early October, we also received the green light for our SBIC number three. We are extremely gratified that our long-term track record and excellent relationship with the SBA will result in attractively priced long-term financing for the company.”


On September 25, 2019, PNNT priced its public offering of $75 million of 5.50% unsecured notes due October 15, 2024, trading under the symbol “PNNTG” and are included in the BDC Google Sheets and currently considered a ‘Hold’.


As shown below, equity investments are now around 18% of the portfolio due to the recent markups discussed next. PNNT will likely continue to use higher leverage as it increases the amount of first-lien positions that account for 57% of the portfolio (up from 40% two years ago).


PNNT’s net asset value (“NAV”) per share increased by $0.11 or 1.3% (from $8.68 to $8.79) mostly due to marking up some of its equity positions including AKW Holdings and RAM Energy.


Also, there was a meaningful markup of its first-lien position in AKW as shown below:


There are still no investments on non-accrual status and energy, oil & gas exposure decreased from 12.2% to 11.3% of the portfolio due to the increase in the overall size of the portfolio and marking down its investment in ETX Energy by almost $3.4 million partially offset by the markups in RAM Energy. Also, PNNT finally exited its publicly traded shares U.S. Well Services (USWS) driving most of the $12 million of realized losses for the quarter.

One of my concerns is the recent markup of PNNT’s equity position in RAM Energy that continues to operate at a loss according to the SEC filings:


PT Networks was also marked up likely due to improved financials:

Again, there were no additional share repurchases due to only around $0.5 million of availability. Previously, PNNT purchased 1 million shares during the three months ended March 31, 2019, at a weighted average price of around $7.10 per share or a 22% discount to its previously reported NAV per share.

Previous call: “We purchased $7 million of a common stock this quarter as part of our stock repurchase program, which was authorized by our board. We’ve completed our program and have purchased $29.5 million of stock. The stock buyback program is accretive to both NAV and income per share. The accretive effect of our share buyback was $0.03 per share.”


This information was previously made available to subscribers of Premium BDC Reports, along with:

  • PNNT target prices and buying points
  • PNNT risk profile, potential credit issues, and overall rankings
  • PNNT dividend coverage projections and worst-case scenarios
  • Real-time changes to my personal portfolio

To be a successful BDC investor:

  • As companies report results, closely monitor dividend coverage potential and portfolio credit quality.
  • Identify BDCs that fit your risk profile.
  • Establish appropriate price targets based on relative risk and returns (mostly from regular and potential special dividends).
  • Diversify your BDC portfolio with at least five companies. There are around 50 publicly traded BDCs; please be selective.

GLAD Update: Dividend Coverage & Risk Profile

The following is from the GLAD Update that was previously provided to subscribers of Premium BDC Reports along with revised target prices, dividend coverage and risk profile rankings, potential credit issues, earnings/dividend projections, quality of management, fee agreements, and my personal positions for all business development companies (“BDCs”).


glad yield.png

GLAD Update Summary:

  • GLAD hit base case projections covering its dividend that remains stable but reliant on continued management fee waivers.
  • There was a meaningful decline in its portfolio yield from 12.5% to 11.3% and its debt-to-equity remains near historical levels.
  • NAV per share decreased by $0.14 or 1.7% (from $8.22 to $8.08). Most of the largest markdowns during the quarter were equity investments including Defiance Integrated Technologies that was previously marked $3.7 million above cost.
  • As predicted, New Trident and Meridian Rack & Pinion were exited resulting in realized losses but did not impact NAV due to being mostly written off.
  • The company sold 705,031 shares at a weighted-average price of $10.37 (26% premium to previous NAV) through its ATM program.
  • In October 2019, GLAD redeemed its Series 2024 Term Preferred Stock and completed a public debt offering of $38.8 million of 5.375% Notes due 2024 for net proceeds of approximately $37.5 million.
  • First-lien debt accounts for around 50% of the portfolio and oil & gas investments now account for around 7.9% (previously 8.7%) of the portfolio fair value due to markdowns and increased overall portfolio size.

December 31, 2019 Results:

Gladstone Capital (GLAD) hit its base case projections covering its dividend due to continued management fee waivers. There was a meaningful decrease in its portfolio yield from 12.5% to 11.3% and its debt-to-equity remained near historical levels. The company sold 705,031 shares at a weighted-average price of $10.37 (26% premium to previous NAV) through its at-the-market (“ATM”) program. In October 2019, GLAD redeemed its Series 2024 Term Preferred Stock and completed a public debt offering of $38.8 million of 5.375% Notes due 2024 for net proceeds of approximately $37.5 million.

Bob Marcotte: “We started fiscal 2020 on a strong note with a healthy level of net originations and a reduction in our financing costs on the quarter which combined to lift our core net interest income despite the pressure associated with the decline in LIBOR. Today, our modest leverage and the added flexibility of BDC leverage relief (with the recent preferred stock redemption), afford us the opportunity to continue to grow our investment portfolio and lift our net interest earnings in the coming quarters to enhance the returns to our shareholders.”


For the three months ended December 31, 2019, net asset value (“NAV”) per share decreased by $0.14 or 1.7% (from $8.22 to $8.08) with realized losses of almost $6 million or $0.19 per share mostly due to exiting New Trident (cost of $4.4 million, fair value of $0.0 million). Also, in January 2020, GLAD exited its non-accrual investment in Meridian Rack & Pinion, Inc. (cost of $5.6 million, fair value of $0.0 million) and realized a loss of $5.6 million or $0.18 per share offset by the sale of its investment in The Mochi Ice Cream Company, which resulted in a realized gain of approximately $2.5 million or $0.08 per share.

Most of the largest markdowns during the quarter were equity investments including Defiance Integrated Technologies that was previously marked $3.7 million above cost but marked down by $2.7 million:


Secured first-lien debt increased from 44% to 50% of the portfolio fair value:


Management previously indicated that it would slowly increase its targeted debt-to-equity ratio from 0.80 to 1.00. In January 2020, GLAD invested:

  • $5.5 million in Lignetics, Inc., an existing portfolio company, through a combination of secured second lien debt and preferred equity.
  • $3.0 million in Edge Adhesives Holdings, Inc., an existing portfolio company, in the form of preferred equity.

Oil & gas investments declined to 7.9% (previously 8.7%) of the portfolio fair value due to marking down FES Resources Holdings again as well as a larger overall portfolio.

As discussed in previous reports, Francis Drilling Fluids (“FDF”) was restructured in December 2018 upon emergence from Chapter 11 bankruptcy protection. As part of the restructure, its $27 million debt investment in FDF was converted to $1.35 million of preferred equity and common equity units in a new entity, FES Resources Holdings, LLC (“FES Resources”). GLAD also invested an additional $5.0 million in FES Resources through a combination of preferred equity and common equity and was marked down by $3.1 million during calendar Q3 2019.

In March 2019, two of its energy-related portfolio companies, Impact! Chemical Technologies, Inc. (“Impact”) and WadeCo Specialties, Inc. (“WadeCo”), merged to form Imperative Holdings Corporation (“Imperative”). In connection with the merger, GLAD received a principal repayment of $10.9 million and its first-lien loans to Impact and WadeCo were restructured into one $30.0 million second lien debt investment in Imperative.

Distributions and Dividends Declared:

In January 2020, the Board of Directors declared the following monthly distributions to common stockholders and monthly dividends to preferred shareholders:


This information was previously made available to subscribers of Premium BDC Reports, along with:

  • GLAD target prices and buying points
  • GLAD risk profile, potential credit issues, and overall rankings
  • GLAD dividend coverage projections and worst-case scenarios
  • Real-time changes to my personal portfolio

To be a successful BDC investor:

  • As companies report results, closely monitor dividend coverage potential and portfolio credit quality.
  • Identify BDCs that fit your risk profile.
  • Establish appropriate price targets based on relative risk and returns (mostly from regular and potential special dividends).
  • Diversify your BDC portfolio with at least five companies. There are around 50 publicly traded BDCs; please be selective.


FDUS Baby Bonds FDUSZ (Buy), FDUSG (Hold) & FDUSL (Sell)

The following is from the FDUS  Deep Dive that was previously provided to subscribers of Premium BDC Reports along with revised target prices, dividend coverage and risk profile rankings, potential credit issues, earnings/dividend projections, quality of management, fee agreements, and my personal positions for all business development companies (“BDCs”).


Annotation 2020-02-16 171839.png


Baby Bonds “FDUSG”, “FDUSZ” and “FDUSL”:

On October 16, 2019, FDUS announced the closing of its $55 million of its 5.375% notes due 2024 under the trading symbol “FDUSG” “within 30 days of October 16, 2019” that has been added to the BDC Google Sheets along with “FDUSL” and “FDUSZ” already included.

There is a good chance that FDUSL will be redeemed this year as it carries a rate of 5.875% and became redeemable as of February 1, 2020.

—————–

One of the metrics used to analyze the safety of a debt position (including Baby Bonds) is its “Interest Expense Coverage” ratio which measures the ability to pay current borrowing expenses. From Investopdia:

“The interest coverage ratio is used to determine how easily a company can pay their interest expenses on outstanding debt. The ratio is calculated by dividing a company’s earnings before interest and taxes (EBIT) by the company’s interest expenses for the same period. The lower the ratio, the more the company is burdened by debt expense. When a company’s interest coverage ratio is only 1.5 or lower, its ability to meet interest expenses may be questionable. The ratio measures how many times over a company could pay its outstanding debts using its earnings. This can be thought of as a margin of safety for the company’s creditors should the company run into financial difficulty down the road. The ability to service its debt obligations is a key factor in determining a company’s solvency and is an important statistic for shareholders and prospective investors.”

The following table shows the last four quarters of FDUS’s earnings with an average interest coverage ratio of 3.4 implying that the company can easily cover its debt payments:

Annotation 2020-02-16 172728.png

—————–


This information was previously made available to subscribers of Premium BDC Reports, along with:

  • FDUS target prices and buying points
  • FDUS risk profile, potential credit issues, and overall rankings
  • FDUS dividend coverage projections and worst-case scenarios
  • Real-time changes to my personal portfolio

To be a successful BDC investor:

  • As companies report results, closely monitor dividend coverage potential and portfolio credit quality.
  • Identify BDCs that fit your risk profile.
  • Establish appropriate price targets based on relative risk and returns (mostly from regular and potential special dividends).
  • Diversify your BDC portfolio with at least five companies. There are around 50 publicly traded BDCs; please be selective.

OCSL Update:Dividend Coverage & Risk Profile

The following is from the OCSL Update that was previously provided to subscribers of Premium BDC Reports along with revised target prices, dividend coverage and risk profile rankings, potential credit issues, earnings/dividend projections, quality of management, fee agreements, and my personal positions for all business development companies (“BDCs”).


Annotation 2020-02-16 171527.png


OCSL Update Summary:

  • OCSL reported below its base case projections due to a meaningful decline in portfolio yield and interest income as well as lower fee income.
  • NAV per share remained stable due to realized/unrealized gains combined with operating earnings covering the dividend for the quarter.
  • OCSL has covered its dividend by an average of 121% with average earnings of around $0.115 per share over the last four quarters partially due to reduced borrowing rates.
  • However, dividend coverage has been trending lower and I will reassess pricing after the earnings call and updating the projections.
  • The company has growth capital available given its historically low leverage with a current debt-to-equity ratio of 0.58. Moody’s and Fitch have recently assigned OCSL investment-grade credit ratings (Moody’s, Baa3 / Stable, and Fitch, BBB- / Stable).
  • Management has made meaningful progress shifting the portfolio from ‘non-core’ legacy assets that account for 13% of the portfolio (previously 16%).
  • First-lien investments account for 57% of the portfolio and non-accruals are very low at 0.03% due to mostly being written off.


OCSL Dividend Coverage Update:

For the quarter ended December 31, 2019, Oaktree Specialty Lending (OCSL) reported below its base case projections due to a meaningful decline in portfolio yield and interest income as well as lower fee income. OCSL has covered its dividend by an average of 121% with average earnings of around $0.115 per share over the last four quarters partially due to reduced borrowing rates. The company has growth capital available given its historically low leverage with a current debt-to-equity ratio of 0.58. Moody’s and Fitch have recently assigned OCSL investment-grade credit ratings (Moody’s, Baa3 / Stable, and Fitch, BBB- / Stable).

Armen Panossian CEO/CIO: “OCSL delivered another quarter of strong performance, highlighted by our eighth consecutive quarter of NAV growth. While leverage grew as a result of these originations, we remain below our target range and have ample dry powder and liquidity to invest opportunistically. In addition, we were recently assigned investment-grade credit ratings by Fitch and Moody’s, reflecting the strength and quality of Oaktree’s credit platform, the progress that we have made in reducing exposure to non-core investments and our significant borrowing capacity.”


Net realized and unrealized gains were $6 million for the quarter “primarily reflecting realized gains from the sale of a portion of its investment in Yeti Holdings, Inc. and unrealized appreciation on certain debt and equity investments.” OCSL is currently considered a ‘Level 1’ dividend coverage due to its rebounding NAV per share, realized gains and the potential for improved coverage through portfolio growth and rotating out of non-core investments redeployed “into proprietary investments with higher yields”:

“Over time, the Company intends to rotate out of the remaining investments it has identified as non-core investments, which were approximately $174.0 million at fair value as of December 31, 2019. It will also seek to redeploy non-income generating investments comprised of equity investments, limited partnership interests and loans currently on non-accrual status into proprietary investments with higher yields.”

As shown in the following table, the company will likely earn at least $0.099 per share each quarter covering 104% of the current dividend which is basically ‘math’ driven by an annual hurdle rate of 6% on equity before paying management incentive fees.

“The payment of the incentive fee on income is subject to payment of a preferred return to investors each quarter (i.e., a “hurdle rate”), expressed as a rate of return on the value of the Company’s net assets at the end of the most recently completed quarter, of 1.50% [6% annualized], subject to a “catch up” feature.”

This calculation is based on “net assets” per share which have continued to grow driving a higher amount of “pre-incentive fee net investment income” per share before management earns its income incentive fees. As shown in the analysis below, the “Minimum Dividend Coverage” continues to grow along with NAV:

—————–

Management was previously asked about a potential dividend increase due to continuing to overearn the dividend and mentioned:

“In terms of the dividends, we were, as we discussed, we’re focused on the stable kind of cash earnings and the dividend has generated from the — they come from the portfolio to payout the dividend. So we’re thoughtful about that as we think about our dividend and capital strategy.”

As of December 31, 2019, OCSL had almost $22 million of cash and $322 million of undrawn capacity on its credit facility. On June 28, 2019, shareholders approved the reduced asset coverage requirements allowing the company to double the maximum amount of leverage effective as of June 29, 2019. The investment adviser reduced the base management fee to 1.0% on all assets financed using leverage above 1.0x debt-equity. Management mentioned “we have no near-term plans to increase our leverage above our target range of 0.70 to 0.85 times”:

From previous call: “As you will recall last quarter, we received Board approval to increase our leverage, effective in February 2020, unless we were to receive shareholder approval before then. While we have no near-term plans to increase our leverage above our target range of 0.70 to 0.85 times, this is an opportunity cost efficiently seeks shareholder approval in the events, but in the future, we deem the appropriate to deploy higher leverage. In connection with this, our base management fee will be reduced to 1% on all assets, finance using leverage above 1.0 times debt to equity once the new leverage limits are in effect.”

Management previously amended its revolving credit facility terms including extending the reinvestment period and modifying the asset coverage ratio covenant.


OCSL Risk Profile Update:

As shown below, management has made meaningful progress shifting the portfolio from ‘non-core’ legacy assets that now account for around 13% (previously 16%) of the portfolio fair value.

Armen Panossian CEO/CIO: “We successfully exited three non-core positions and added $134 million of new investments, the majority of which were privately placed to businesses that align with our late-cycle approach to investing.

—————–

Three investments remain on on-accrual status but have already been written down and are now only 0.03% of the portfolio fair value:

—————–

As of December 31, 2019, 57% of the portfolio was first-lien as 90% of the new investments during the recent quarter were first-lien.

—————–

NAV per share remained stable due to the previously discussed realized/unrealized gains combined with operating earnings covering the dividend for the quarter:


This information was previously made available to subscribers of Premium BDC Reports, along with:

  • OCSL target prices and buying points
  • OCSL risk profile, potential credit issues, and overall rankings
  • OCSL dividend coverage projections and worst-case scenarios
  • Real-time changes to my personal portfolio

To be a successful BDC investor:

  • As companies report results, closely monitor dividend coverage potential and portfolio credit quality.
  • Identify BDCs that fit your risk profile.
  • Establish appropriate price targets based on relative risk and returns (mostly from regular and potential special dividends).
  • Diversify your BDC portfolio with at least five companies. There are around 50 publicly traded BDCs; please be selective.


CGBD Article Preview & Why I Sold

The following is from the CGBD Deep Dive that was previously provided to subscribers of Premium BDC Reports along with revised target prices, dividend coverage and risk profile rankings, potential credit issues, earnings/dividend projections, quality of management, fee agreements, and my personal positions for all business development companies (“BDCs”).


Annotation 2020-02-15 164405.png

Annotation 2020-02-15 172813.png


CGBD Update Summary:

  • The following is a preview for a Seeking Alpha article coming out early next week discussing the pros and cons of investing CGBD including conservative asset valuations/dividend philosophy, share repurchases, new management, and investor perceptions of recent credit issues likely driving its discounted stock price.
  • CGBD reported Q3 2019 results on November 6, 2019, and I sold my position due to the additional declines of valuations in ‘watch list’ investments as shown below.
  • Later this month, CGBD will likely report an additional investment on non-accrual which was previously considered its largest ‘watch list’ investment. Investors should be prepared for volatility.

TCG BDC (CGBD) is a business development company (“BDC”) externally managed by Carlyle GMS Investment Management and part of the Carlyle Group, which is a global alternative asset manager with $222 billion of AUM across ~360 investment vehicles providing CGBD access to scale, relationships and expertise, which has advantages including incremental fee income and higher investment yields.

On May 14, 2019, Michael A. Hart, CGBD’s Chairman of the Board and the Chief Executive Officer, informed the Board that he had determined to resign from the Board and as the Chief Executive Officer of the Company, effective December 31, 2019, to pursue other interests.

Linda Pace basically assumed the new role of President shortly after the announcement and formally took over on January 1, 2020. Overall, I see this as a positive for the company as she has added “more people, focus, and resources to the BDC platform”.

Previous Declines in CGBD’s Stock Price

CGBD was formerly known as Carlyle GMS Finance, Inc. and closed its IPO on June 19, 2017, selling 9 million shares with four lockup periods each releasing 25% of an additional ~52 million pre-IPO shares. On April 24, 2019, the Board unanimously voted to accelerate the elimination of the final transfer restriction (the “Lock-Up”) applicable to shares purchased by investors prior to the company’s initial public offering (“Pre-IPO Shares”). The final “Release Date” resulted in additional technical pressure driving lower prices similar to previous Release Dates as shown below.

As discussed in previous articles, my last purchase of CGBD shares was during the December 2018 decline which was a combination that included the previous general market pullback as discussed by management on a previous call:

There is the release of the pre-IPO shares. As you probably also remember that puts enormous technical pressure on the stock. It had previously and history has shown that it did again here, but that’s also complemented or contributed with the overall sell-off in the BDC space as well as the overall general sell-off in the broader market.

BDC Buzz Sale of CGBD

As mentioned in each article, it is important for investors to closely watch the reported quarterly results for BDCs including potential credit issues that could result in lower net asset values (NAV/book values) as well as non-accruals that could result in lower dividend coverage. CGBD reported Q3 2019 results on November 6, 2019, and I sold my position at $14.25 due to the additional declines of valuations in ‘watch list’ investments as shown below:


Derm Growth Partners

My last public article discussing CGBD was “Building A Retirement Portfolio With 6% To 9% Yield: Part 2” with an updated watch list for CGBD showing the recent declines including Derm Growth Partners at the top of the table (and largest). This investment has been continually marked down and as shown in the previous table, it was marked down to 70% of cost in Q3 2019.

Also, it was recently reported by Bloomberg that U.S. Dermatology Partners:

defaulted on a $377 million financing provided by a group of investment firms, according to people with knowledge of the matter. The dermatology practice owner is now reviewing its options, including a recapitalization or debt-for-equity swap with its current lenders, Golub Capital, The Carlyle Group Inc. and Ares Management, according to the people, who asked not to be identified because they aren’t authorized to speak about it.

Pieces of the loan, which matures in May 2022 and carries interest at 7.25% over Libor, are held in private credit vehicles called business development companies for Golub and Carlyle, according to regulatory filings. The BDCs were most recently marking the debt at about 69 cents to 74 cents on the dollar as of Sept. 30, the filings show.

On February 7, 2020, I sent out multiple updates to subscribers mentioning “this could be a good time to sell some CGBD near recent highs” and ” I will hold my GBDC” due to the impact to the following loans:

  • “Derm Growth Partners” for CGBD – $39 million FV or around $0.66/share = 4% maximum impact to NAV.
  • “Oliver Street Dermatology Holdings, LLC” for GBDC – $23 million FV or around $0.17/share = 1% maximum impact to NAV.

As shown below, volume picked up quite a bit on February 7, 2020, with most subscribers getting out higher or near $14.00.


As of September 30, 2019, Derm Growth Partners accounted for around 4% of CGBD’s NAV:


CGBD management discussed Derm Growth Partners on the previous call:

Q. “Okay, thank you. Could you also talk about, I think, Derm Growth Partners III, that’s something another one that you’re carrying, bit of a discount to costs. I’m not sure if there’s something incremental that happened this quarter or if you could just give an update on the company. Thank you.”

A. “Yeah, the update I’d give on that credit is we’re working through some operational and financial performance challenges with the sponsor and the company, but unlike some of the other positions such as dimensional which was the other large mark down this quarter. This is a first lien tranche, so we expect in the situation a very different outcome than we had on dimensional which obviously being junior debt, in a underperforming situation, the recovery prospects on that one is much difference, that’s an important distinction I would draw between the two borrowers.”

As mentioned in previous articles, management takes a conservative approach to valuing its portfolio:

When we held our initial earnings call as a public company back in August of 2017, I highlighted that based on our robust valuation policy, each quarter you may see changes in our valuations based on both underlying borrower performance as well as changes in market yields and that movement evaluations may not necessarily indicate any level of credit quality deterioration.

Source: CGBD Q4 2018 Earnings Conference Call Transcript

Golub Capital (GBDC) is also invested in this asset under the name Oliver Street Dermatology Holdings, LLC which was placed on non-accrual status during Q4 2019 as announced last week. During the most recent call, GBDC management discussed additional non-accruals (including Oliver Street Dermatology) mentioning that they are “cautiously optimistic that in respect of both companies, we are on a good path toward good recoveries”:

So non-accruals at cost and fair value increased in the most recent quarter to 1.6% and 1.3%, respectively. Whenever we think about non-accruals, we feel a degree of concern, right. We are naturally worriers. We worry about everything. One of the things we worry about is non-accruals. I want to make sure, though, that everyone keeps our concerns in appropriate context. So first, this quarter GBDC continued its strong track record of generating positive net realized and unrealized gains on investments. And that’s the metric that we think is, over time, the most important indicator of credit performance. That’s why we focus so much in our earnings presentation each quarter on the chart in our presentation depicting NAV per share over time. A second way we look at credit and overall credit quality is based on risk ratings, I think they show a great deal of stability quarter-over-quarter and for many quarters in a row. And the third contextual point I will make is that the latest figures indicate that even with this small increase, we are still in the low end of the range of the industry and we are in our historical range in respect of non-accruals at cost. So I don’t want to make any of this sound like it’s more dramatic than it is. With that said, we are working hard with the managements of the two companies that we put on non-accrual this quarter and I can’t get into the details of either of the two situations, but what I can say is, I am cautiously optimistic that in respect of both companies, we are on a good path toward good recoveries.

Source: GBDC Q1 2020 Results – Earnings Call Transcript

GBDC’s investment in Oliver Street Dermatology was marked at 79% of cost which is above CGBD’s 9/30 valuation at 70% implying that this asset was conservatively marked even before CGBD adds to non-accrual. This is a sign of quality management which is why I will be closely watching upcoming results for CGBD.


CGBD Share Repurchases, Management & Fee Agreement

I consider CGBD to have higher quality management for various reasons including the previously discussed conservative asset valuations, share repurchases, previously waived management fees, conservative dividend policy driving continued/potentially additional special dividends and a shareholder friendly-fee structure of 1.50% base management fee (compared to 2.00%) and an incentive fee of 17.5% (compared to the standard 20.0%). However, the current fee agreement is not best-of-breed as it does not include a ‘total return hurdle’ to take into account capital losses when calculating the income incentive fees.

On November 4, 2019, the Board authorized a 12-month extension of its $100 million stock repurchase program at prices below reported NAV per share through November 5, 2020, and in accordance with the guidelines specified in Rule 10b-18 of the Exchange Act. The company has repurchased around $52 million worth of shares representing approximately $0.14 in NAV accretion for shareholders.

We continue to be active in share repurchases during the third quarter as we do not believe our valuation reflects the intrinsic value of our company with a broad capabilities of the Carlyle platform. We repurchased $17 million of shares during the quarter and inception to-date, the $52 million in repurchase activity has led to $0.14 in accretion to NAV. We have approximately $48 million remaining on our $100 million repurchase authorization which earlier this week, our board extended for another year. It is our intent to continue repurchasing shares at or near our current valuation.”

Source: CGBD Q3 2019 Results – Earnings Call Transcript


Conclusion and CGBD Recommendations

  • If you are like me, a conservative investor that does not like surprises, you likely already sold CGBD. Those that have not should be ready for volatility over the next two weeks.
  • If you are a more aggressive investor looking for higher returns and yield, you may have been buying including when the stock was trading at $13.15 (20%+ discount to NAV of $16.58) waiting for the company to report positive results and NAV reflation.

Items to keep in mind:

  • On January 1, 2020, Linda Pace formally took over as CEO. Overall, I see this as a positive for the company as she has “added more people, focus, and resources to the BDC platform”.
  • Previously, CGBD repurchased around $52 million worth of shares and hopefully continued to repurchase shares in Q4 2019 that will have a positive impact to NAV.
  • CGBD takes a conservative approach to valuing its portfolio assets.
  • CGBD had already marked Derm Growth Partners at 70% of cost as of September 30 compared to GBDC that marked it down to 79% of cost as of December 31.

My best guess is that CGBD’s stock price will drop after the company reports Q4 2019 results on February 25, 2020 (see table below) due to continued overreaction as this is a relatively new public company and has already reported a few quarters with credit issues.

What will I be doing?

I will be doing the same thing that I mentioned in the CGBD Deep Dive from November 2019:

I will not be repurchasing shares until after the company reports Q4 2019 results.

This information was previously made available to subscribers of Premium BDC Reports, along with:

  • CGBD target prices and buying points
  • CGBD risk profile, potential credit issues, and overall rankings
  • CGBD dividend coverage projections and worst-case scenarios
  • Real-time changes to my personal portfolio

BDCs have started to report calendar year-end results. Investors should be watching for potential portfolio credit issues that could lead to credit rating downgrades. Lower ratings would likely drive higher borrowing expenses that could put downward pressure on net interest margins and dividend coverage over the coming quarters.

Annotation 2020-02-15 165805.png

To be a successful BDC investor:

  • As companies report results, closely monitor dividend coverage potential and portfolio credit quality.
  • Identify BDCs that fit your risk profile.
  • Establish appropriate price targets based on relative risk and returns (mostly from regular and potential special dividends).
  • Diversify your BDC portfolio with at least five companies. There are around 50 publicly traded BDCs; please be selective.

AINV Update: Risk Profile & Dividend Coverage

The following is from the AINV Update that was previously provided to subscribers of Premium BDC Reports along with revised target prices, dividend coverage and risk profile rankings, potential credit issues, earnings/dividend projections, quality of management, fee agreements, and my personal positions for all business development companies (“BDCs”).


Annotation 2020-02-13 024415.png


AINV Update Summary:

  • AINV beat its best-case projections, covering its dividend but only due to additional markdowns (same as previous quarter) resulting in minimal incentive fees paid. AINV would have only covered 97% of its dividend if the full incentive fees had been paid.
  • NAV per share declined by another $0.42 or 2.3% (from $18.69 to $18.27) due to additional markdowns mostly due to its ‘non-core legacy assets’.
  • Total realized/unrealized losses were partially offset by accretive share repurchases (adding $0.02 per share) and overearning the dividend.
  • On January 31, 2020, Fitch downgraded AINV’s senior unsecured debt rating to ‘BB+’ from ‘BBB-‘ but with ‘Stable Outlook’ that was previously ‘Negative’.
  • Portfolio growth was higher-than-expected and the company repurchased 0.5 million shares at a 16% discount to the previously reported NAV resulting in an increased debt-to-equity ratio of 1.47 as the company utilizes its access to higher leverage.
  • The “core strategies” portion of the portfolio now accounts for 88% of all investments.
  • However, the average leverage during the quarter was 1.27 implying higher earnings in the coming quarter.
  • In 2020, AINV has not repurchased shares “given the recent rally in the stock”.
  • Total non-accruals account for 0.7% of total investments at fair value (previously 1.0%) and 2.0% of total investments at cost (previously 2.1%). If these investments were completely written off, it would impact NAV by another $0.31 or 1.7%.

For calendar Q4 2019, Apollo Investment (AINV) beat best-case projections but only due to minimal incentive fees paid during the quarter driven by the ‘total return hurdle’:

“Net investment income for the quarter was $0.54 cents per share reflecting the net portfolio of growth and they were total return feature in our incentive fee structure, which resulted in a nominal incentive fee for the quarter.”

I was expecting a portion of credits to the incentive fees for calendar Q4 2019 but there were additional markdowns related to its ‘non-core’/oil and gas investments resulting in lower incentive fees paid during the quarter. As shown in the following table, the company would have only covered 97% of its dividend if the full incentive fees had been paid. The Board maintained its distribution of $0.45 per share.

Net asset value (“NAV”) per share declined by another $0.42 or 2.3% (from $18.69 to $18.27) due to additional markdowns mostly due to its ‘non-core legacy assets’ partially offset by accretive share repurchases (adding $0.02 per share) and overearning the dividend.

“Net asset value per share was 18.27 at the end of December down 2.3% quarter over quarter. The $0.42 net reduction in NAV per share was due to a $.54 net loss on the portfolio partially offset by net investment income in excess of the distribution of $0.09, and a $0.02 accretive impact from share repurchases. Noncore and legacy assets accounted for $.51 or 95% of the net loss, oil and gas accounted for $0.19 of loss, legacy assets for $0.18, renewable $0.13 and shipping $0.01.”

There were no new non-accruals that declined due another markdown of its oil and gas investment in Spotted Hawk. Total non-accruals currently account for 0.7% of total investments at fair value (previously 1.0%) and 2.0% of total investments at cost (previously 2.1%). If these investments were completely written off, it would impact NAV by another $0.31 or 1.7%.

“No investments were placed on or removed from nonaccrual status. At the end of December investments on nonaccrual status represented 0.7% of the portfolio fair value down from 1% last quarter and 2% at cost down from 2.1% last quarter.”

Portfolio growth was higher-than-expected and the company repurchased 0.5 million shares at a 16% discount to the previously reported NAV resulting in an increased debt-to-equity ratio (leverage) of 1.47 as the company utilizes its access to higher leverage. However, the average leverage during the quarter was 1.27 implying higher earnings in the coming quarter:

“It is important to note that average leverage for the quarter was 1.27 times and client at the larger portfolio will continue to drive earnings growth in the current quarter.”

In February 2019, the Board approved a new stock repurchase plan to acquire up to $50 million of the common stock. The new plan was in addition to the existing share repurchase authorization that was fully utilized during the quarter. Since the inception of the share repurchase program, AINV has repurchased over 12 million shares at a weighted average price per share of $16.83 for a total cost of almost $208 million. Since the end of the quarter, AINV has not repurchased any shares.

“Given the recent rally in the stock, no shares have been purchased since early November. We believe that stock buybacks are the most accretive use of shareholder capital when the stock is trading at a meaningful discount on that. Our board has authorized $50 million plans for total authorization of $250 million. Today we have repurchased over $208 million of stock below NAV, which has accreted $0.68 to NAV per share. We believe the combination of AINV fee structure changes and active stock repurchase program demonstrate our commitment to creating value for our shareholders.”


As mentioned in previous reports, the company is in the process of repositioning the portfolio into safer assets including reducing its exposure to oil & gas, unsecured debt, and CLOs. The “core strategies” portion of the portfolio now accounts for 88% of all investments:

Mr. Howard Widra, AINV’s CEO commented, “We continued to successfully implement our plan to prudently grow our portfolio with first lien floating rate corporate loans sourced by the Apollo Direct Origination platform, while continuing to reduce our exposure non-core and legacy assets as well as second lien loans. We believe the risk profile of our portfolio continues to improve which allows us to operate at a higher leverage ratio. In addition, this quarter was an important inflection point in the makeup of our non-core portfolio. The non-core portfolio decreased by approximately $67 million through the combination of repayments and unrealized losses, reducing non-core assets to 12% of the portfolio. In addition, the risk attributable to our remaining non-core portfolio has decreased due to the successful restructuring of our investment in Carbonfree Chemicals. The combination of this restructuring and the accretive impact of the reinvestment of the proceeds received from non-core and legacy repayments has allowed us to have a smaller and better collateralized non-core portfolio while improving the overall earnings profile of Apollo Investment.


On January 31, 2020, Fitch downgraded AINV’s senior unsecured debt rating to ‘BB+’ from ‘BBB-‘ but with ‘Stable Outlook’ that was previously ‘Negative’. This will be discussed in the updated Deep Dive report.

“The ratings downgrade reflects the increase in balance sheet leverage, which has not been sufficiently offset by a reduction in portfolio risk, and Fitch’s expectation that Apollo’s leverage (debt/equity) could increase above the previously articulated maximum target of 1.40x; as well as an increased reliance on secured debt funding, which reduces the firm’s funding flexibility. Apollo’s ratings remain supported by its affiliation with the AGM platform; which provides access to investment resources and deal flow; the firm’s experienced management team; and improving portfolio risk profile, including above- average portfolio exposure to first lien investments compared to rated BDC peers. Rating constraints include Apollo’s weaker-than-peer track record in credit; the continuation of execution risk associated with the portfolio mix shift given the firm’s mixed track record and the highly competitive environment; and continued exposure, albeit declining, to certain non-core and legacy investments, which include energy, shipping, renewables.”

AINV previously amended its Senior Secured Facility increasing commitments by $70 million which increased the size of the facility to $1.71 billion.


Its aircraft leasing through Merx Aviation remains the largest investment but is now below 13% of the portfolio and continues to pay dividend income. As mentioned in previous reports, AINV has been reducing its concentration risk including reducing its exposure to Merx. Energy, oil and gas investments account for around 4.0% of the portfolio (due to recent markdowns) as compared to 4.8% during the previous quarter:


This information was previously made available to subscribers of Premium BDC Reports, along with:

  • AINV target prices and buying points
  • AINV risk profile, potential credit issues, and overall rankings
  • AINV dividend coverage projections and worst-case scenarios
  • Real-time changes to my personal portfolio

To be a successful BDC investor:

  • As companies report results, closely monitor dividend coverage potential and portfolio credit quality.
  • Identify BDCs that fit your risk profile.
  • Establish appropriate price targets based on relative risk and returns (mostly from regular and potential special dividends).
  • Diversify your BDC portfolio with at least five companies. There are around 50 publicly traded BDCs; please be selective.

Prospect Capital (PSEC) Risk Profile & Dividend Coverage Update

The following is from the PSEC Projections that was previously provided to subscribers of Premium BDC Reports along with revised target prices, dividend coverage and risk profile rankings, potential credit issues, earnings/dividend projections, quality of management, fee agreements, and my personal positions for all business development companies (“BDCs”).


Annotation 2020-02-10 024018.png


For calendar Q3 2019, Prospect Capital (PSEC) reported below its base case projections due to another decline in portfolio investments and lower-than-expected portfolio yield. Interest and total income continue to decline with a debt-to-equity at 0.70 (lower end of target range).

As predicted, its net asset value (“NAV”) per share decreased by 1.6% or $0.14 (from $9.01 to $8.87) due to additional markdowns in its CLO investments, Valley Electric , CP Energy Services and non-accrual investments including InterDent, Inc. USES Corp. and Pacific World. These losses were partially offset by gains in National Property REIT Corp. (“NPRC”) and its non-accrual investment in Edmentum Ultimate Holdings that is now marked at 143% of cost but still on non-accrual.


Non-accruals declined due to the previously discussed markdowns and currently around 8.1% of the portfolio at cost and declined to around 2.4% at fair value (previously 3.0%).


As mentioned in the previous report, primary concerns include portfolio concentration issues including its “top 10 investments accounting for over 40% of the portfolio” and the amount of equity investments. Also mentioned was that “InterDent, Inc. remains one of its largest investment and needs to be watched.” Previously, PSEC extended its loans to InterDent, which were past due as well as being marked down “but still marked near cost and likely overvalued”. During calendar Q2 2018, PSEC assumed control of InterDent and as shown in the following table, PSEC only placed around $41 million of the $252 million loans with InterDent on non-accrual. There is a chance that the other loans could be placed on non-accrual that would have a meaningful impact upcoming to dividend coverage. Also, InterDent still accounts for around $0.56 per share or 6.3% of NAV.


—————–

Its Term A and B loans to Pacific World remain on non-accrual status and continue to be marked down but still account for around $0.27 per share or 3.1% of NAV.


I consider PSEC to have a higher risk portfolio due to the previous rotation into higher yield assets during a period of potentially higher defaults and later stage credit cycle concerns, CLO exposure of 16% combined with real-estate 16%, online consumer loans of 2%, consumer finance of 12% and energy, oil & gas exposure of 3%. As mentioned in previous reports, Moody’s and S&P Global Ratings also consider the CLO, real-estate and online lending to be riskier allocations that currently account for almost 34% of the portfolio.

Moody’s Investors Service/Standard & Poor’s Global Ratings:

Moody’s Investors Service: Baa3/ Outlook Stable

On February 26, 2019, Moody’s Investors Service (Moody’s) assigned a rating of to Prospect Capital Corporation’s (“PSEC”) senior unsecured convertible notes due 2025. The outlook for PSEC’s ratings is stable.

Moody’s could upgrade PSEC’s ratings if the company: 1) decreases debt/tangible equity to not more than .7x, doesn’t increase its structured credit and real estate exposures as a proportion of total investments, further enhances financial flexibility by obtaining prior shareholder consent to issue shares at a price below net asset value, and generates profitability that consistently compares well with BDC peers, taking into consideration differences in investment strategies.

Moody’s could downgrade the ratings if PSEC increases the ratio of net debt to equity to more than .85x, increases structured credit and real estate equity investments without decreasing leverage, pays dividends that exceed net investment income on a regular basis, or generates profitability that is weaker than expected compared to peers.

Standard & Poor’s Global Ratings: Credit Rating: BBB-/Outlook Stable

On October 12, 2018, S&P Global Ratings affirmed its ‘BBB-‘ issuer credit rating on Prospect Capital Corp. (“PSEC”) and previously removed the ratings from CreditWatch, where they were placed on April 3, 2018, with negative implications. The negative outlook was due to “PSEC’s leverage near the upper end of our expectations for the ratings and our view that certain of its investments may have more volatile valuations than typical BDC investments.” The stable outlook reflects S&P Global Ratings’ expectation that Prospect Capital Corp. (PSEC) will maintain reported debt to equity below 0.85x and will not adopt a modified asset coverage requirement from the current 200%. We expect PSEC will maintain investment portfolio results consistent with other BDCs that we rate investment grade.

We could lower the ratings over the next 12-24 months if:

  • Reported debt to equity rises to 0.85x or higher or debt to ATE rises to 1.50x or higher
  • The investment portfolio’s risk increases or performance deteriorates, as indicated by rising realized or unrealized losses or non-accruals


This information was previously made available to subscribers of Premium BDC Reports, along with:

  • PSEC target prices and buying points
  • PSEC risk profile, potential credit issues, and overall rankings
  • PSEC dividend coverage projections and worst-case scenarios
  • Real-time changes to my personal portfolio

To be a successful BDC investor:

  • As companies report results, closely monitor dividend coverage potential and portfolio credit quality.
  • Identify BDCs that fit your risk profile.
  • Establish appropriate price targets based on relative risk and returns (mostly from regular and potential special dividends).
  • Diversify your BDC portfolio with at least five companies. There are around 50 publicly traded BDCs; please be selective.


TSLX Dividend Coverage & Risk Profile Update

The following is from the TSLX Deep Dive that was previously provided to subscribers of Premium BDC Reports along with revised target prices, dividend coverage and risk profile rankings, potential credit issues, earnings/dividend projections, quality of management, fee agreements, and my personal positions for all business development companies (“BDCs”).


TSLX Dividend Coverage Update:

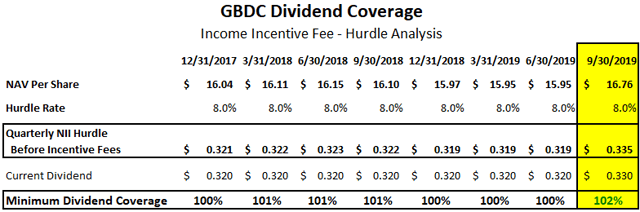
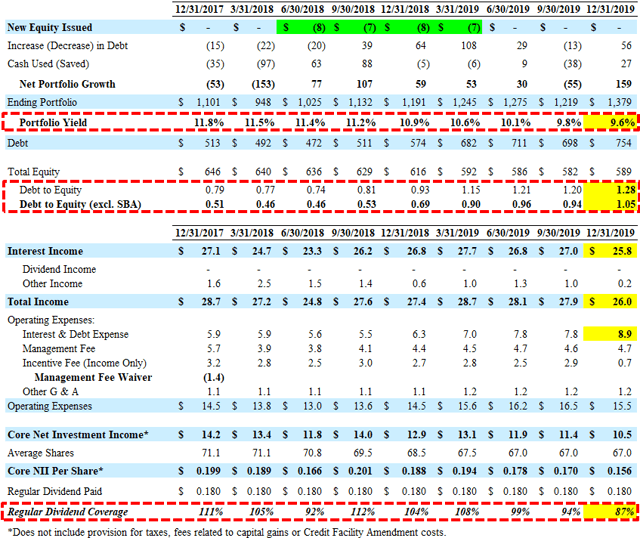
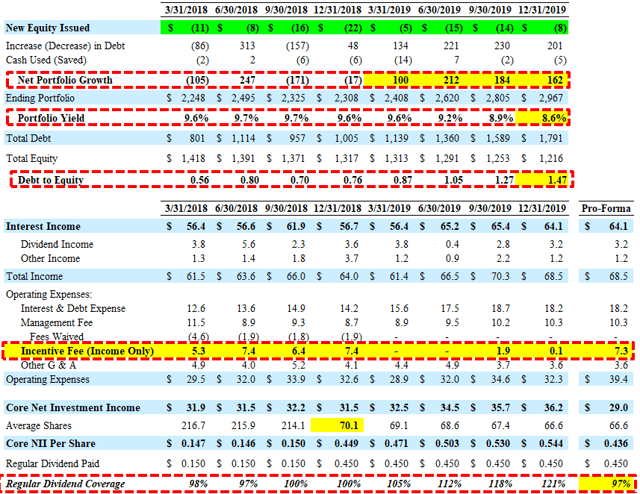
TSLX has covered its regular dividend by an average of 139% over the last four quarters, growing undistributed taxable income and capital gains to $1.60 per share.

“At September 30 our estimated spillover income was approximately $1.60 per share. We will continue to evaluate the best way to comply with this requirement in conjunction with our distribution policy.”

Previous call: “If we believe there is sustainable increase in the earnings power of the business by operating in our target leverage range for an extended period of time, then we would look to resize our base dividend in context of the underlying earnings power of the business to ensure we’re optimizing cash distribution and satisfying risk related distribution requirements. We will continue to monitor undistributed taxable income and gains closely as part of our ongoing review of our distribution strategy.”

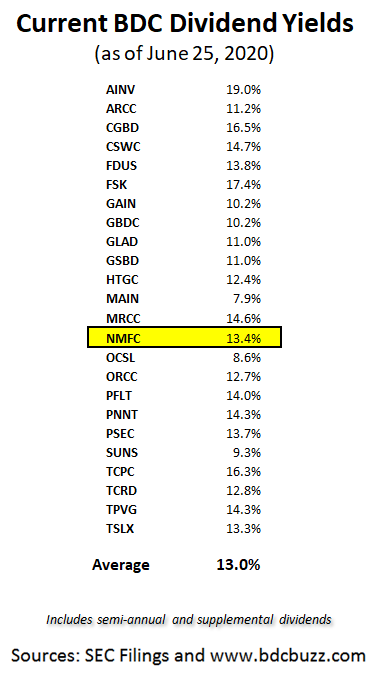
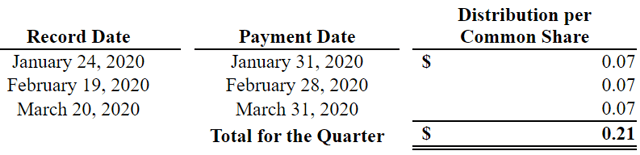
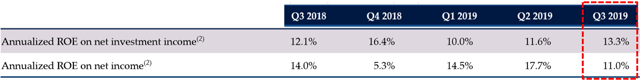
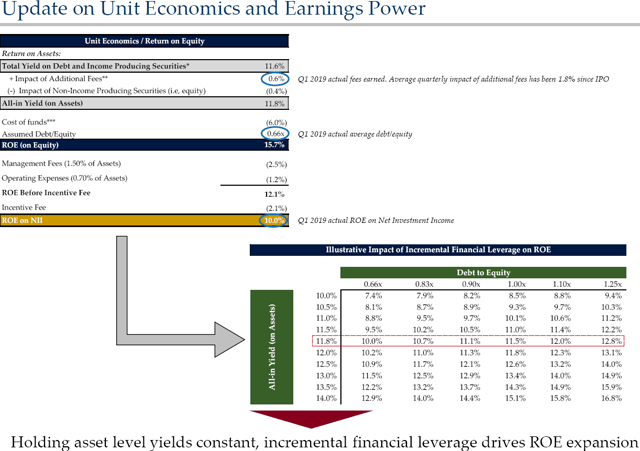
TSLX announced a special/supplemental dividend of $0.08 per share payable in December and annualized ROE for the third quarter 2019 was 13.3% and 11.0% on a net investment income and a net income basis, respectively.

“At the beginning of the year we communicated an annualized ROE target of 11% to 11.5% based on our expectations for net asset-level yields cost of funds and financial leverage. Year to date we’ve generated an annualized ROE on net investment income and net income of 11.8% and 14.6% respectively.

There will likely be around $0.13 per share of realized gains related to the exit of its preferred equity investment in Validity, Inc. that will be used to support upcoming supplemental dividends. This investment was discussed on the previous call:

Previous call: “We continue to hold our convertible preferred equity investment and updated the fair value mark to reflect the valuation from the recent equity investment. We expect to realize our investment at current fair value mark in the near term. If realized, any gains on our equity position at the time of exit would be unwound from the balance sheet and recognized into net income, but won’t flow through to NII.”

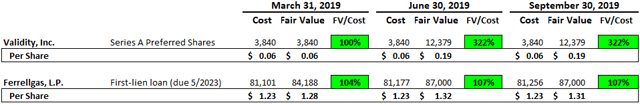
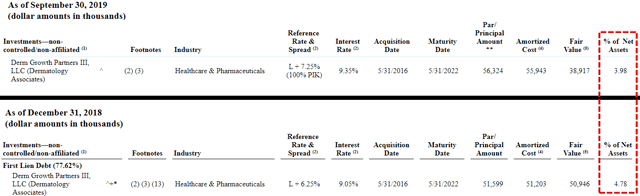
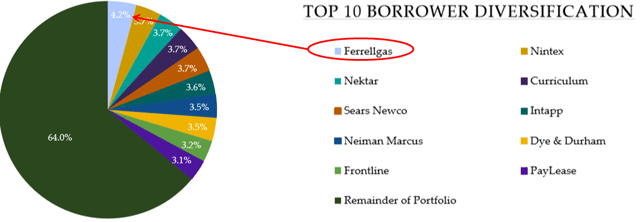
As discussed in previous reports (and previous public article), Ferrellgas Partners (FGP) remains its largest investment and is currently valued at almost $6 million over cost or $0.08 per share and will likely drive additional fee income and realized gains. On January 9, 2020, FGP announced updates to its intention to voluntarily delist from the NYSE and expects that its common shares will trade on the OTC as (“FGPR”). However, its Senior Secured Credit Facility with TSLX is secured with substantially all of the assets of the operating partnership and its subsidiaries, and Ferrellgas Partners’ and the general partner’s partnership interests in the operating partnership, and contains various affirmative and negative covenants and default provisions, as well as requirements with respect to the maintenance of specified financial ratios and limitations on the making of loans and investments.

Previous call: “Ferrellgas is a publicly traded distributor of propane with an enterprise value of $2.3 billion. The company has a defensive core business with high return on invested capital and a strong management team but faced refinancing difficulties given the challenging regulatory environment for banks. Due to our ability to provide a fully underwritten financing solution through co-investments from affiliated funds we were able to structure a first lien last out position at a low attach point of 0.2X at a low net leverage of 1.7X with highly attractive adjusted returns.”

FGP was put on notice of default and previously announced an amendment that includes a waiver of that default, likely driving additional fee income for TSLX in Q4 2019. There is litigation (not including TSLX) from the company’s ESOP trustee and this investment was discussed on the recent call:

“I would like to comment on a recent development for one of our portfolio companies Ferrellgas. This October the company disclosed in its 10-K filing that it is currently in a disagreement with us as the agent on a senior secured credit facility regarding various technical defaults including the going-concern qualification in the company’s most recent audited financial statements report. We continue to work closely with the management on finding a solution.”

“We’ve tried and will continue to try to work with the company and the management team and their advisors on the solution. We would refer people to the litigation in Kansas for more details including the countersuit filed by the company’s employee — a company’s employee’s trustee Great Bank on October 24th for details of the Ferrellgas story. We believe what’s really unfortunate here is that there’s been approximately $2.3 billion of equity value eroded since the company’s peak market cap in September of 2014 representing approximately $600 million of employee plan assets related to the ESOP. This is detailed in that Great Bank countersuit. Obviously it’s a live situation which is fluid. As it related to the mark the mark is actually below the implied call protection that would be contractually owed to us upon a refi if the company chooses to refi us. The company’s capital structure is pretty public. We feel pretty well positioned in the capital structure approximately 2.5x levered. The company has $230 million of EBITDA and the market value of the company’s securities which is mostly unsecured debt outside of us is approximately $2 billion. There’s not much equity value by market cap. I think it’s $50 million to $60 million so we’re very well positioned in the capital structure. Obviously the arc of the Ferrellgas story again is unfortunate specifically as it relates to previous owners and the erosion of the equity value in plan assets although we feel pretty good about where we sit in the capital structure.”

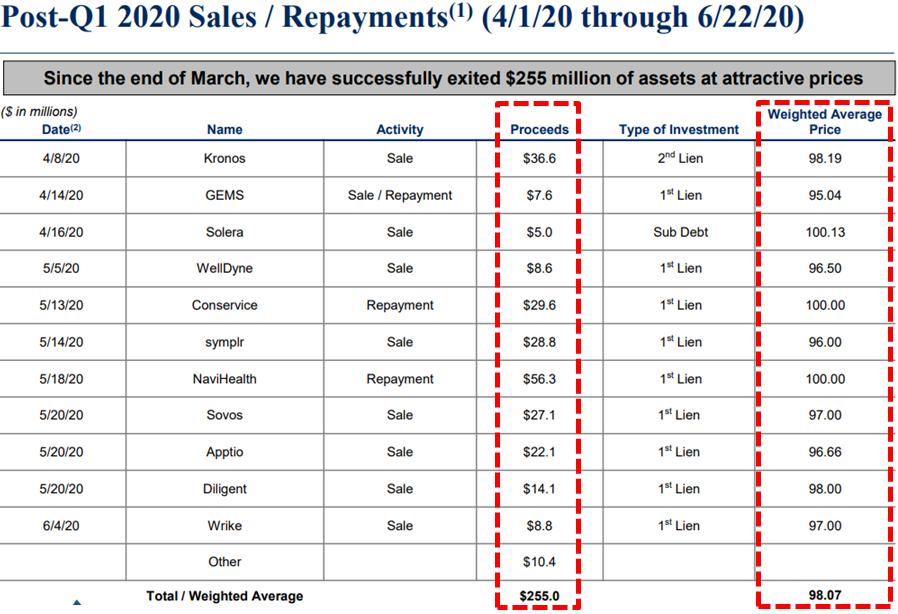
It is important to understand that TSLX management continues to produce higher returns by investing in distressed companies through excellent underwriting standards that protect shareholders during worst-case scenarios including call protection, prepayment fees and amendment fees backed by first-lien collateral of the assets. Historically, higher returns have been partially driven by these strong financial covenants and call protections during periods of higher amounts of prepayments (discussed below) and worst-case scenarios (discussed at the end of this report). However, similar to previous reports, the base case projections do not include large amounts of fee and other income related to early repayments.

“Given our direct origination strategy, 99% of our portfolio by fair value was sourced through non-intermediated channels. At quarter end, we maintained effective voting control on 78% of our debt investments and averaged 1.9 financial covenants per debt investment consistent with historical trends. And we continue to have meaningful call protection on our debt portfolio as a way to generate additional economic should our portfolio get repaid in the near term.”

It also important to point out that the company is able to cover dividends with recurring sources as discussed by management on previous calls:

Previous call: “As we’ve said in the past, in environments where we receive elevated levels of prepayments and a decrease in our financial leverage ratio, we would expect elevated levels of other fees. However, if repayment activity were to decline, then we would expect to leg back into our target leverage ratio, contributing more rapidly to our interest and dividend income line.”

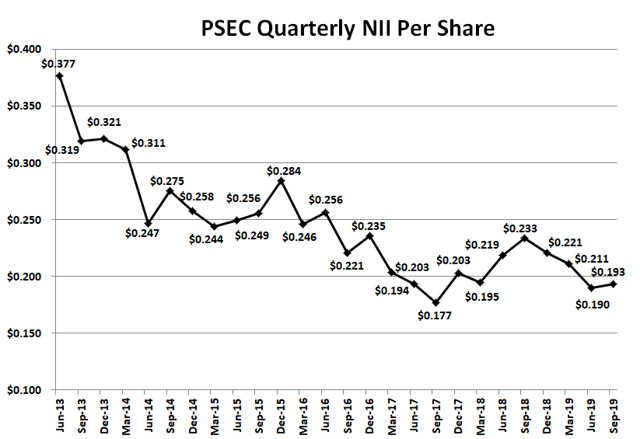
Management gave 2019 NII guidance of $1.77 to $1.85 which is likely conservative, similar to 2017/2018 guidance.

“Given the earnings power of our portfolio and our outlook for portfolio activity for Q4 we would expect to end full-year 2019 at the upper end of our previously shared NII per-share guidance of $1.77 to $1.85.”

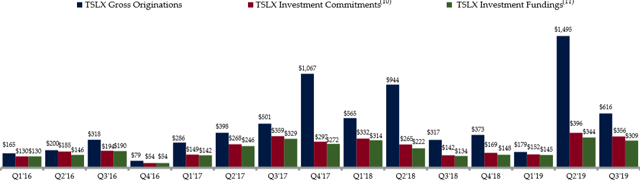
For Q3 2019, TSLX beat best-case projections “driven by higher prepayment fees and accelerated amortization of upfront fees from unscheduled pay downs and higher commitment and agency fees”.


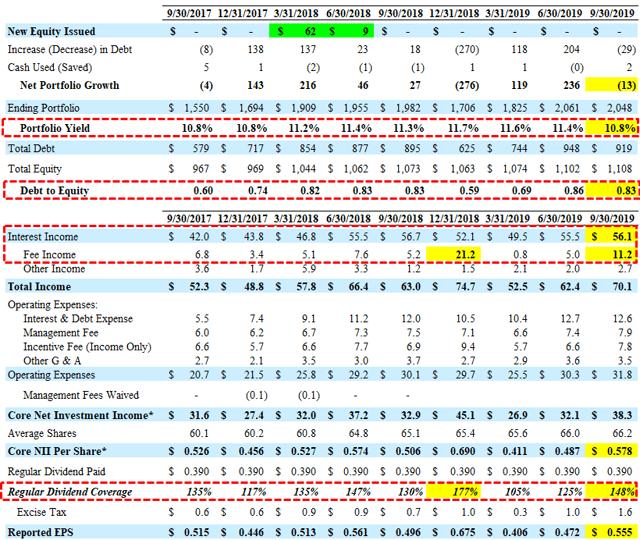
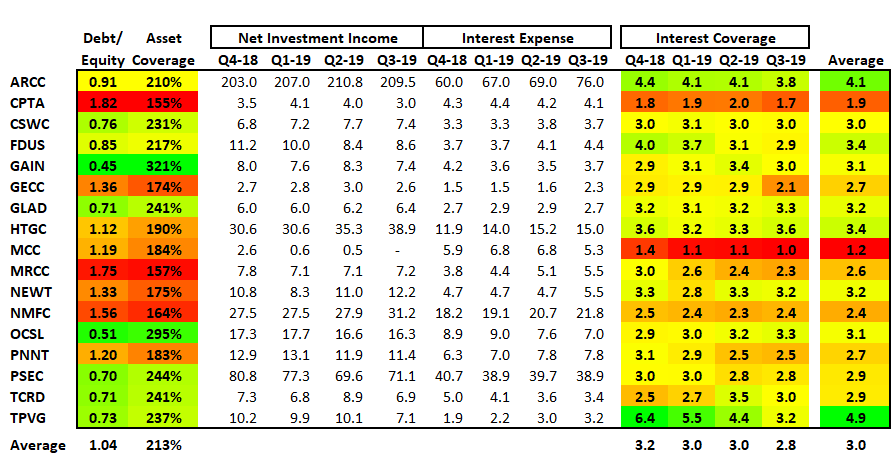
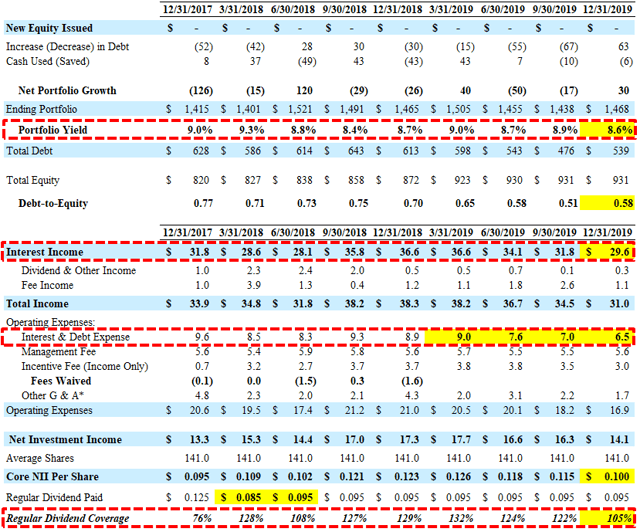
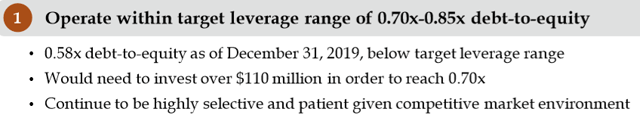
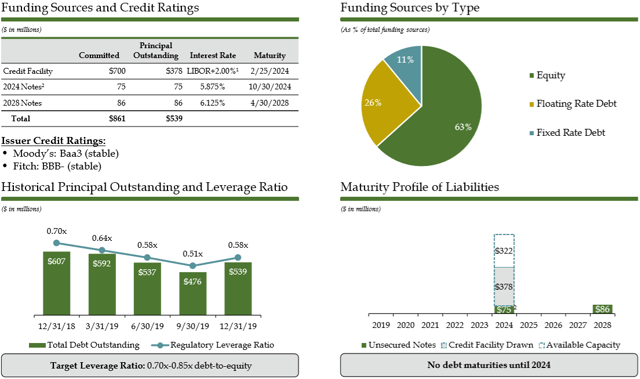
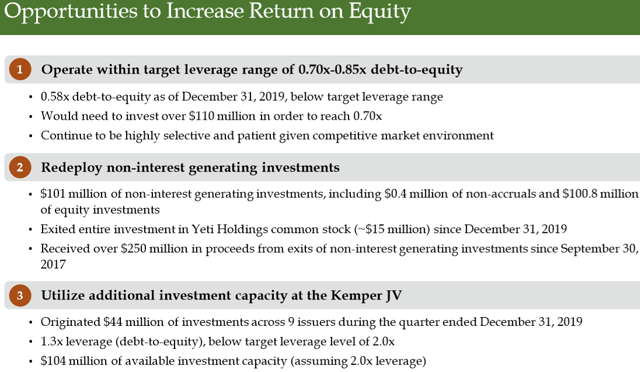
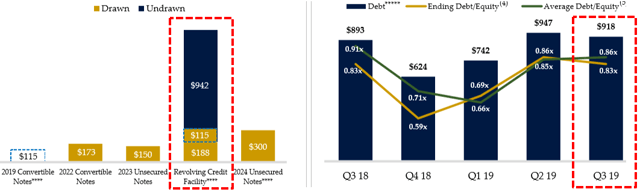
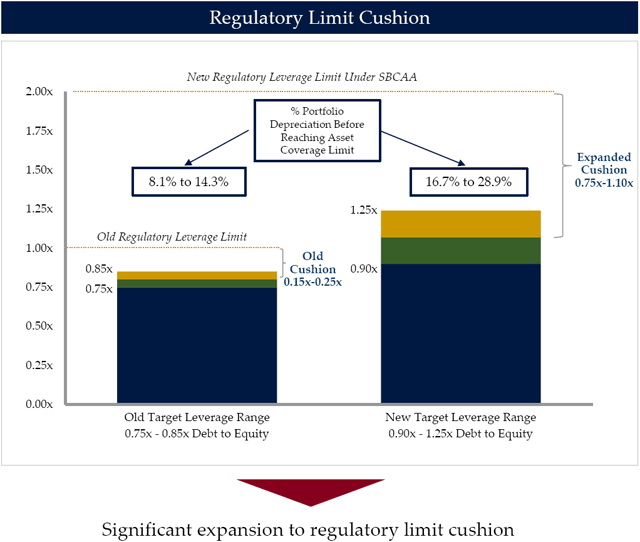
Repayments and exits during Q4 2018 drove its debt-to-equity to a four year low of 0.59 that has slowly increased to 0.83 in Q3 2019 as the company takes a “prudent approach to growth especially in today’s market”:

“Since we increased our target leverage range to 0.9x to 1.25x a little over 12 months ago upon the effectiveness of the lower minimum asset coverage requirement our average quarterly leverage has to date not reached the low end of our targeted range. This is a function of repayment activity in our portfolio as well as our prudent approach to growth especially in today’s market.”


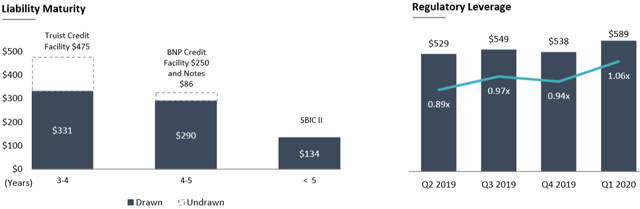
The company still has $942 million of undrawn capacity on its revolving credit facility for additional portfolio growth.


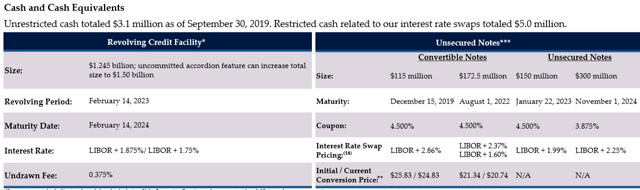
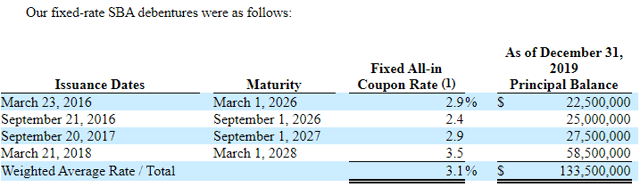
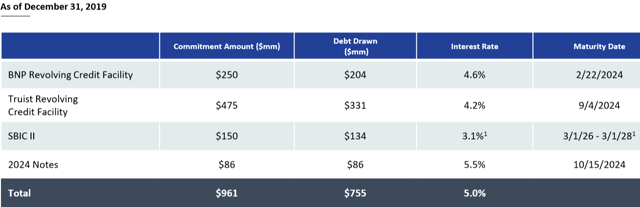
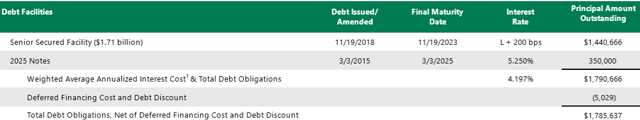
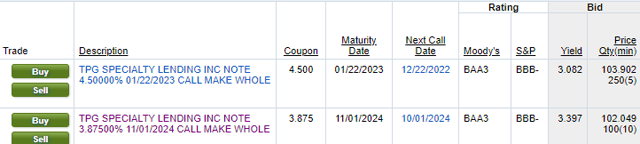
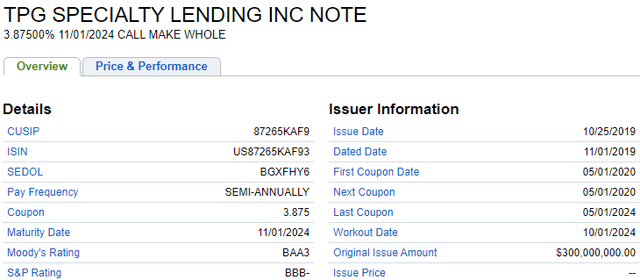
It should be noted that 100% of TSLX’s borrowings are at variable rates (based on LIBOR) but the company is adequately positioned for rising interest rates due to ‘match funding’ with 100% of debt investments at variable rates. TSLX continues to lower its cost of capital and on November 1, 2019, issued $300 million of unsecured 3.875% notes that mature on November 1, 2024, and are tradeable under CUSIP #87265KAF9.

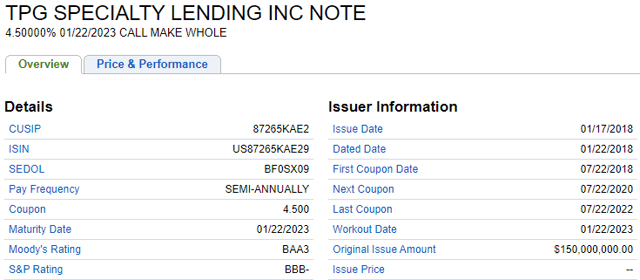
“We issued $300 million of 3.875% 5-year unsecured notes. While the net proceeds were immediately used to repay outstanding amounts under our revolver the additional capital will also be used to effectively replace the $115 million of 4.5% convertible notes that mature in December as well as to provide incremental liquidity under our revolver.”


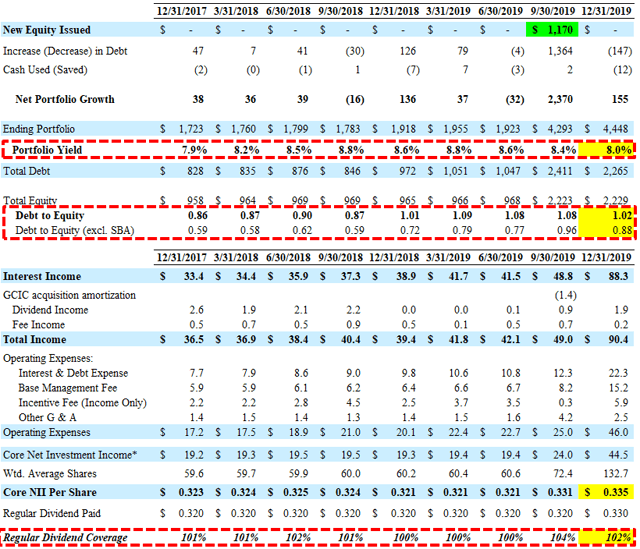
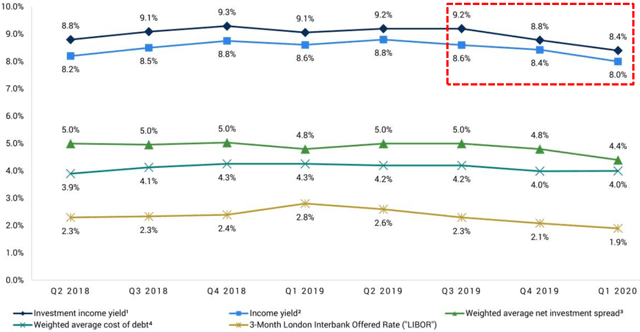
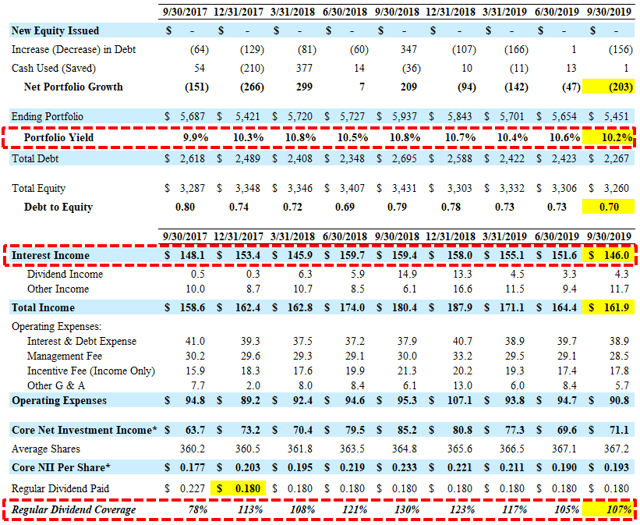
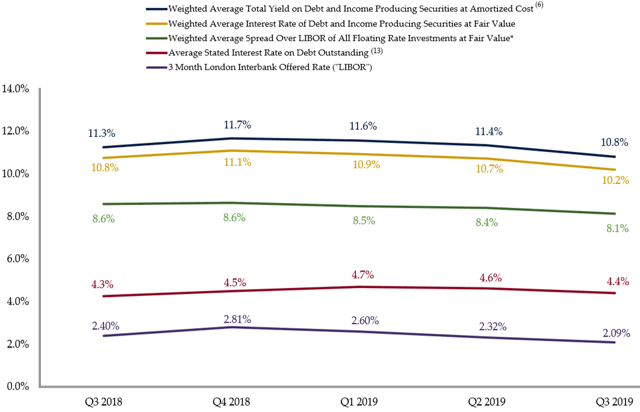
There was a meaningful decline in its portfolio yield (from 11.4% to 10.8 %) due to repayments from higher-yielding investments and new investments at lower yields as well as lower LIBOR:

“This quarter the weighted average total yield on our debt and income producing securities at amortized cost was 10.8% a decrease of 54 basis points from the prior quarter. Breaking this down 24 basis points was due to the decrease in LIBOR on our floating rate portfolio and 30 basis points was due to the impact of new versus exiting investments. This was an atypical quarter where a number of stronger yielding investments with a weighted average total yield of 12.7% were repaid. The weighted average total yield on new investments was lower at 10.4% and this was impacted by both the yield and the size of our Neiman ABL investment.”

—————–

In October 2018, TSLX’s shareholders overwhelmingly approved the proposal to allow the company to increase leverage by approving the application to the company of a minimum asset coverage ratio of 150% effective October 9, 2018. TSL Advisers, LLC intends to waive a portion of the management fee in excess of an annual rate of 1.0% on assets financed with higher leverage and revised its target debt-to-equity range from 0.75-0.85 to 0.90-1.25.

“As we said in the past, in periods where we see a decrease in our financial leverage, we would expect elevated levels of other fees from repayment activity to support our ROEs. We believe our revised financial policy will allow us to drive incremental ROEs for our shareholders as we reached the higher end of our leverage target.”

—————–

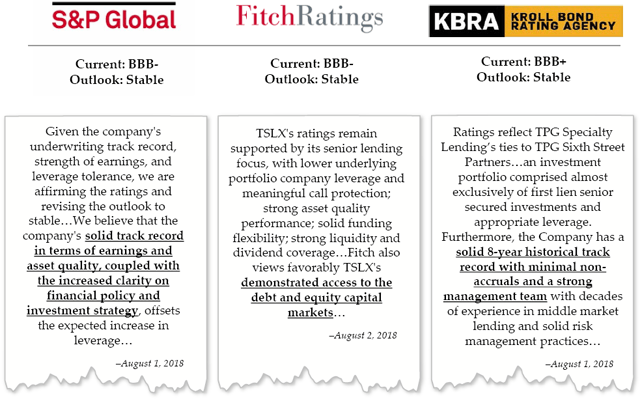
The following are the investment-grade ratings from Fitch, S&P, and Kroll under the new target leverage range of 0.90x-1.25x debt-to-equity.

—————–

TSLX Risk Profile Update:

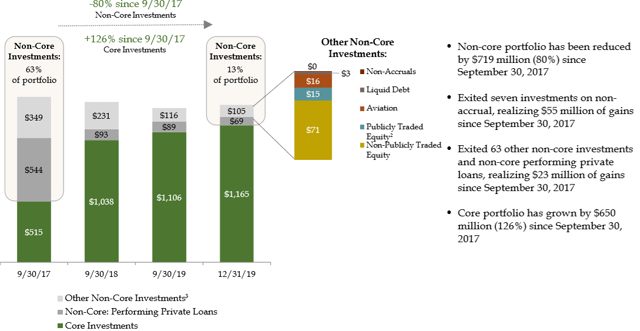
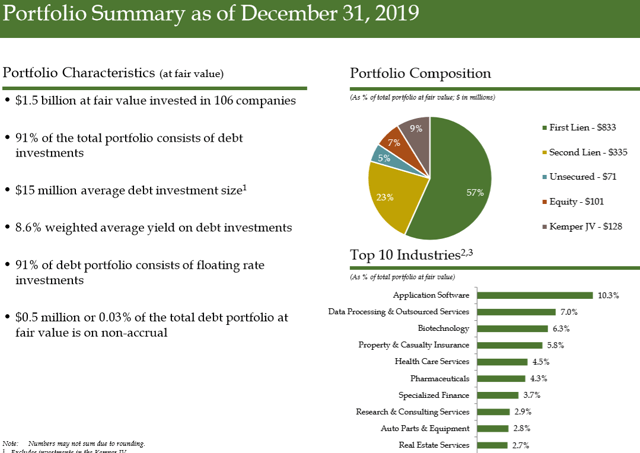
TSLX has a history of selectively growing its portfolio using prudent amounts of leverage, onboarding higher-than-average credit quality first-lien investments at higher-than-market yields and providing better-than-average dividend coverage and returns to shareholders. As discussed earlier, TSLX has excellent underwriting standards that protect shareholders during worst-case scenarios including voting control, call protection prepayment fees and amendment fees backed by first-lien collateral of the assets.

“Given our direct origination strategy, 99% of our portfolio by fair value was sourced through non-intermediated channels. At quarter end, we maintained effective voting control on 78% of our debt investments and averaged 1.9 financial covenants per debt investment consistent with historical trends. And we continue to have meaningful call protection on our debt portfolio as a way to generate additional economic should our portfolio get repaid in the near term.”

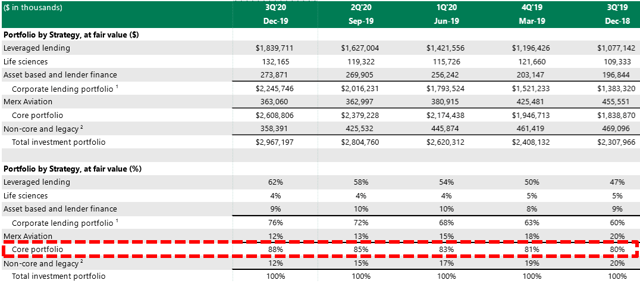
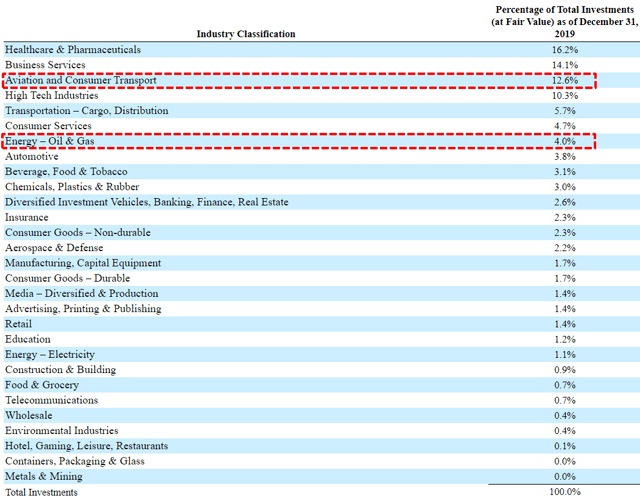
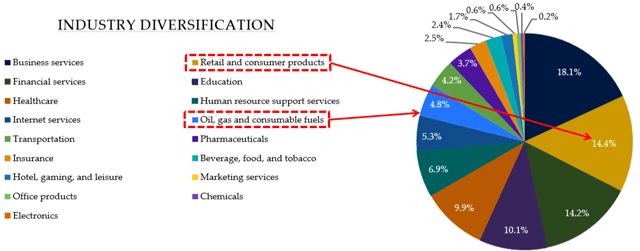
“We continue to be late cycle minded with our exposure to non-energy cyclical industries at an all-time low of 3% of the portfolio at fair value. As a reminder, this figure excludes our retail asset based loan investments, which are supported by liquid collateral values and are not underwritten based on enterprise value, which tends to fluctuate.”

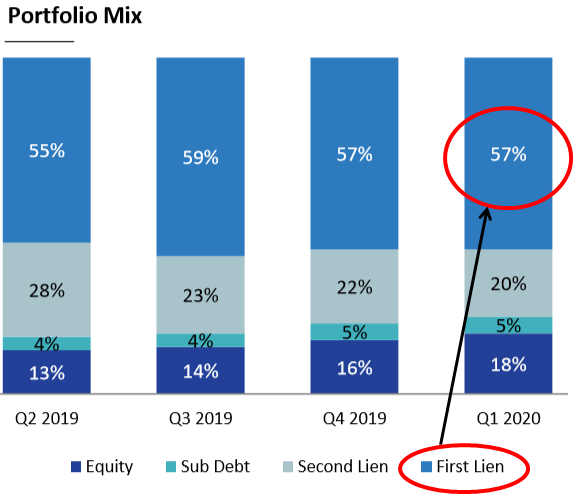
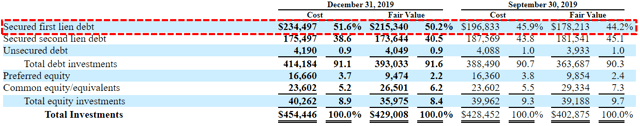
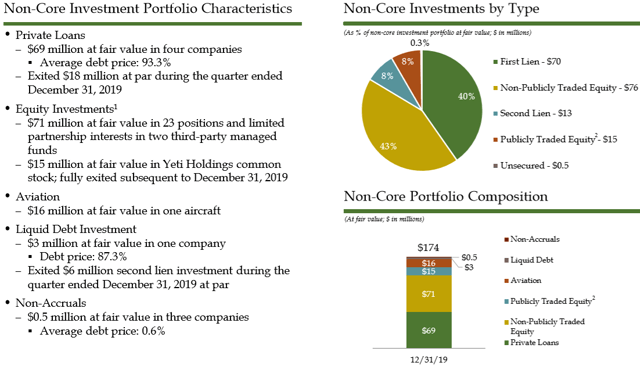
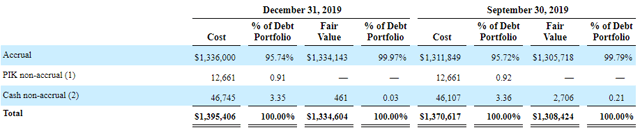
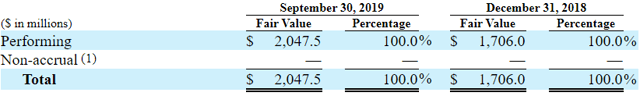
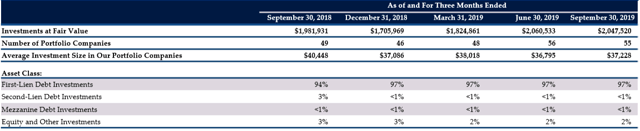
As of September 30, 2019, 100% of the portfolio was meeting all payment and covenant requirements. First-lien debt remains around 97% of the portfolio and management has previously given guidance that the portfolio mix will change over the coming quarters with “junior capital” exposure growing to 5% to 7%.

—————–

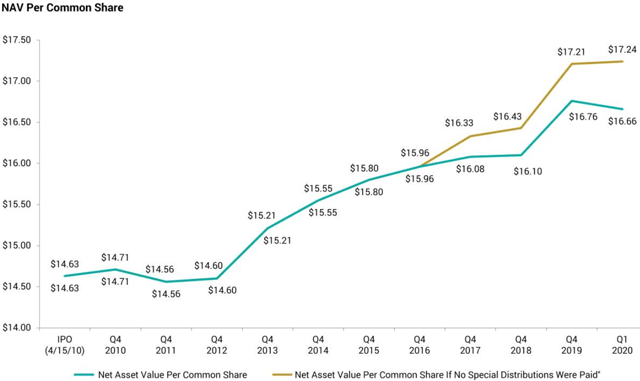
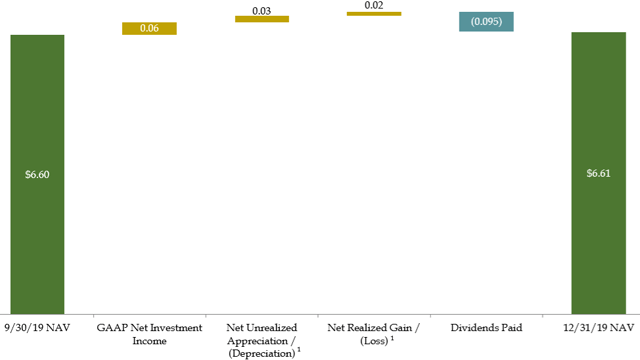
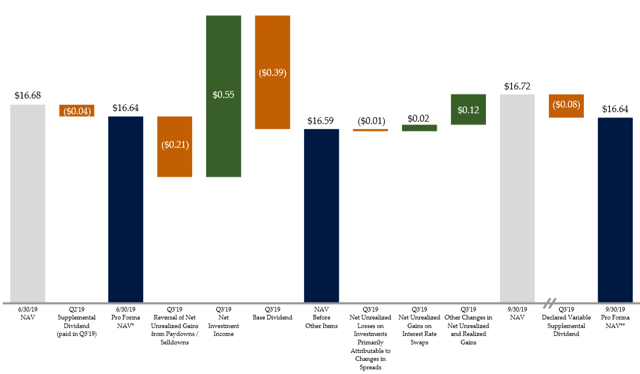
During Q3 2019, TSLX’s net asset value (“NAV”) per share increased by $0.04 or 0.2% (from $16.68 to $16.72) due to overearning the dividend(NYSE:S) paid in Q3 2019 partially offset by markdowns of ‘watch list’ investments discussed next. However, this does not take into account the $0.08 supplemental dividend in Q4 2019:

—————–

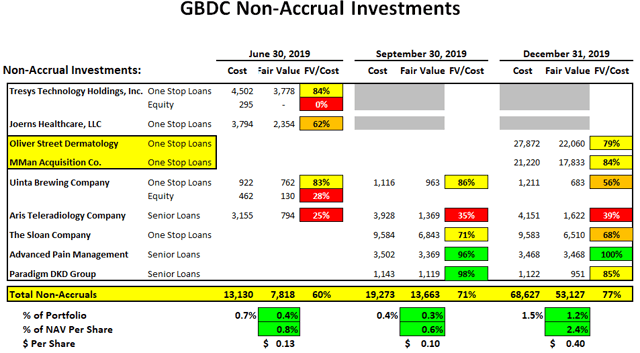
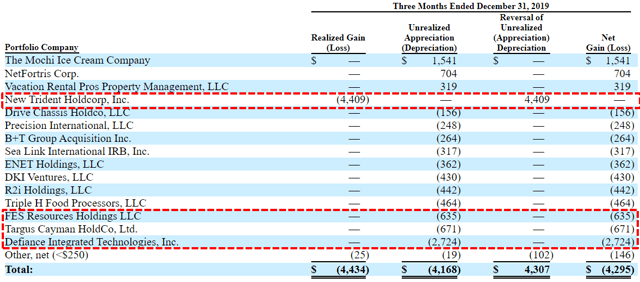
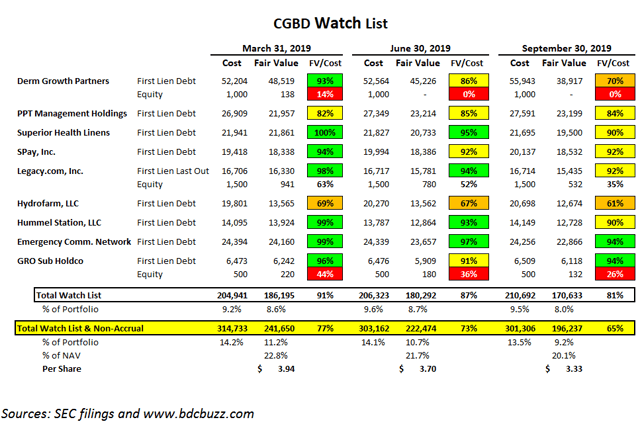
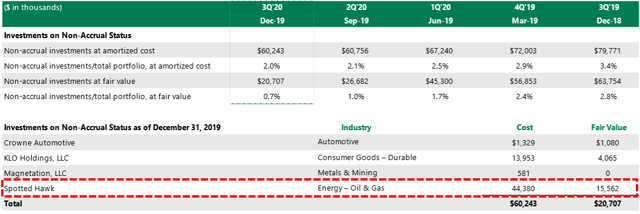
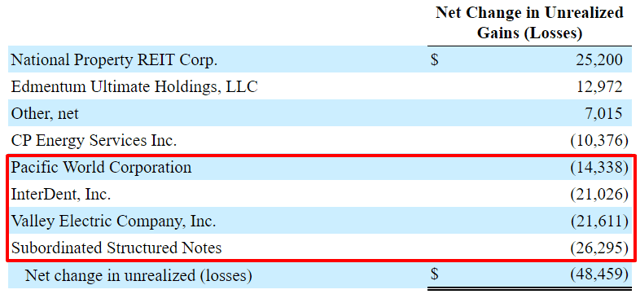
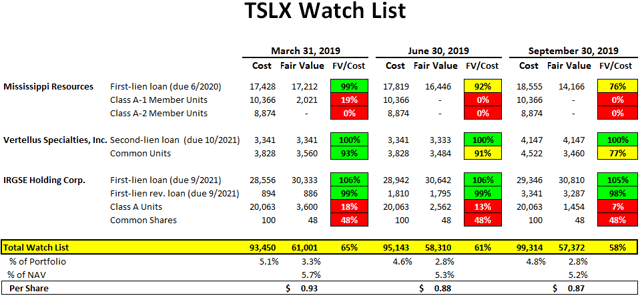
There were additional markdowns in the three ‘watch list’ investments Mississippi Resources, Vertellus Specialties, and IRGSE Holding Corp. The largest markdown during the quarter was its first-lien position in Mississippi Resources to 78% of cost and will likely be added to non-accrual in Q4 2019. However, TSLX’s watch list of 2.8% of the portfolio fair value is among the lowest in the sector making it a key component of the suggested ‘Risk Averse’ portfolio.

—————–

It is important for investors to understand that one of TSLX’s strategies for higher IRRs is investing in distressed retail asset-based lending (“ABL”) as “traditional brick and mortar retail gives way to the rise of e-commerce”. Historically, borrowers have paid amendment fees to avoid even higher prepayment fees if they decided to refinance. Also, the amendments included an additional “borrowing base” providing increased downside protection on the investment. This strategy continues to drive higher fee income including prepayment and amendments fees. See the end of this report for previous examples.

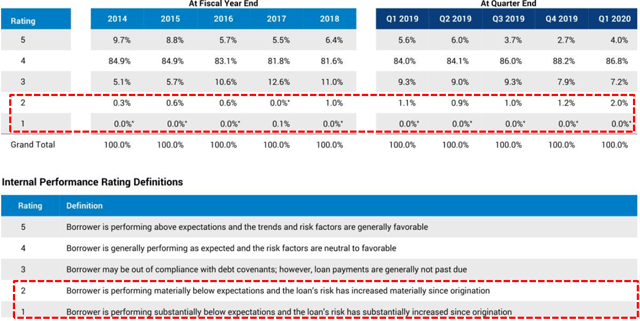
“We’d like to note that our retail exposure is predominantly in the form of asset-based loans secured by liquid working capital collateral and the vast majority of our financial services portfolio companies are B2B integrated software repayment businesses with limited financial leverage and underlying bank regulatory risk. The credit quality of our portfolio remains robust with an average performance rating on a scale of 1 to 5 with 1 being the highest of 1.13 versus 1.18 in the prior quarter.”

The largest new investment during Q3 2019 was Neiman Marcus Group and discussed on the recent call:

“We continue to be fairly active in the retail ABL this year against the backdrop of a particularly challenging year for brick-and-mortar retailers. During the quarter we funded a $72 million par-value asset-based loan to Nieman Marcus to support the company’s strategic initiatives. And post quarter-end as publicly disclosed we and our affiliated funds provided a $75 million asset-based DIP loan to Forever 21 to support the company’s bankruptcy restructuring efforts. We believe both of these investments offer strong risk-adjusted returns given the downside protection of our borrowing-base [levered] loans including in both cases robust asset coverage from liquid working capital collateral.”

“So on Nieman look we have a great relationship with our friends at areas have done numerous asset-based deals including Ninety-Nine Cents and so we have a great relationship. And in addition to that we were involved on one of out other funds our private funds in helping Nieman through the latest restructuring given we were a large holder of the term loan. So given that we know the company been involved with the company you know were constructive with the company in their latest efforts to restructure the balance sheet and we have a ton of experience with the sponsor and you know I think that gave us the opportunity. And so that’s the context of the transaction. Again what I would say is look the portfolio yields bounce around quarter to quarter. I think if you look at Forever 21 quite frankly which is another retail asset-based loan it has a much higher yield to amortized cost. If you know — much much higher. If you look at portfolio — if you pro forma Q3 for Forever 21 I think yield to amortized cost of our portfolio is about 11% to 11.1%. And so the Neiman’s choice was although it was lower yield it probably ultimately will have a little bit of a higher return because it will go to life. There was a whole bunch of suppressed availability which had made it a very good loan. We knew the company and we have a great relationship with the sponsor and have a history of supporting Neiman’s. As it relates to your second question which is why do we own a I think it’s like $700000 Neiman first lien it is under the 40 Act given that we own a different part of that capital structure”

From previous call: “What really matters is, how we think the inventory will liquidate as it compares to what – where we are lending against it. Retail goes as well as the consumer. That is not the – that’s not what’s happening here, right. Consumer is in good health. There is a business model issue and a structural issue with retail, but more so given the fixed cost base and given the discerning mediation of both kind of fast brands and plus Amazon and omni-channel business models. And so, it’s really the liquidation value of inventory and the liquidation value of the inventory has held up great. So, we continue to hope for a decent amount of structural change. So we can provide capital and provide – be a solution provider into that space. And quite frankly, the liquidation values continue to hold up very, very, very well.

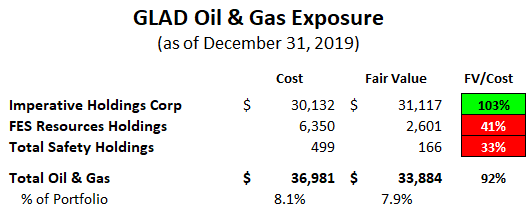
Similar to investing in distressed retail assets, the company is focused on increasing returns through investing opportunistically in oil/energy but only first-lien “with attractive downside protective features in the form of significant hedged collateral value at current price levels”. Management has mentioned that energy exposure would not exceed 10% of the portfolio and only first-lien using appropriate hedges. TSLX made “opportunistic” investments in Energy Alloys in Q3 2019, Verdad Resources in Q2 2019, MD America Energy during Q4 2018, Ferrellgas Partners during Q2 2018 and Northern Oil & Gas in Q4 2017 that was repaid.

Previous quarter: “Another transaction this quarter that highlights our platform’s capabilities is the $225 million term loan facility that we sold at an agent for the Verdad Resources, an upstream E&P company with primary operations in the DJ Basin. This opportunity was sourced with our energy team and coincided with our opportunistic approach of providing first lien reserve based loans to upstream companies situated low on their cost curves at current price levels. Our platform sector expertise and ability to act in size allows us to structure a customized one-stop solution for the company and its sponsor at pricing in terms that provide a strong risk return profile on our investment.


This information was previously made available to subscribers of Premium BDC Reports, along with:

  • TSLX target prices and buying points
  • TSLX risk profile, potential credit issues, and overall rankings
  • TSLX dividend coverage projections and worst-case scenarios
  • Real-time changes to my personal portfolio

To be a successful BDC investor:

  • As companies report results, closely monitor dividend coverage potential and portfolio credit quality.
  • Identify BDCs that fit your risk profile.
  • Establish appropriate price targets based on relative risk and returns (mostly from regular and potential special dividends).
  • Diversify your BDC portfolio with at least five companies. There are around 50 publicly traded BDCs; please be selective.